[edit] This problem is solved! The problem is from project target. I am using uvision5, but I opened the uvision4 project. (\arm4...) Now I am using the example under \arm5_no_packs, and every things work well!! I hope that other developers don't make this mistake...
Hi Nordics!
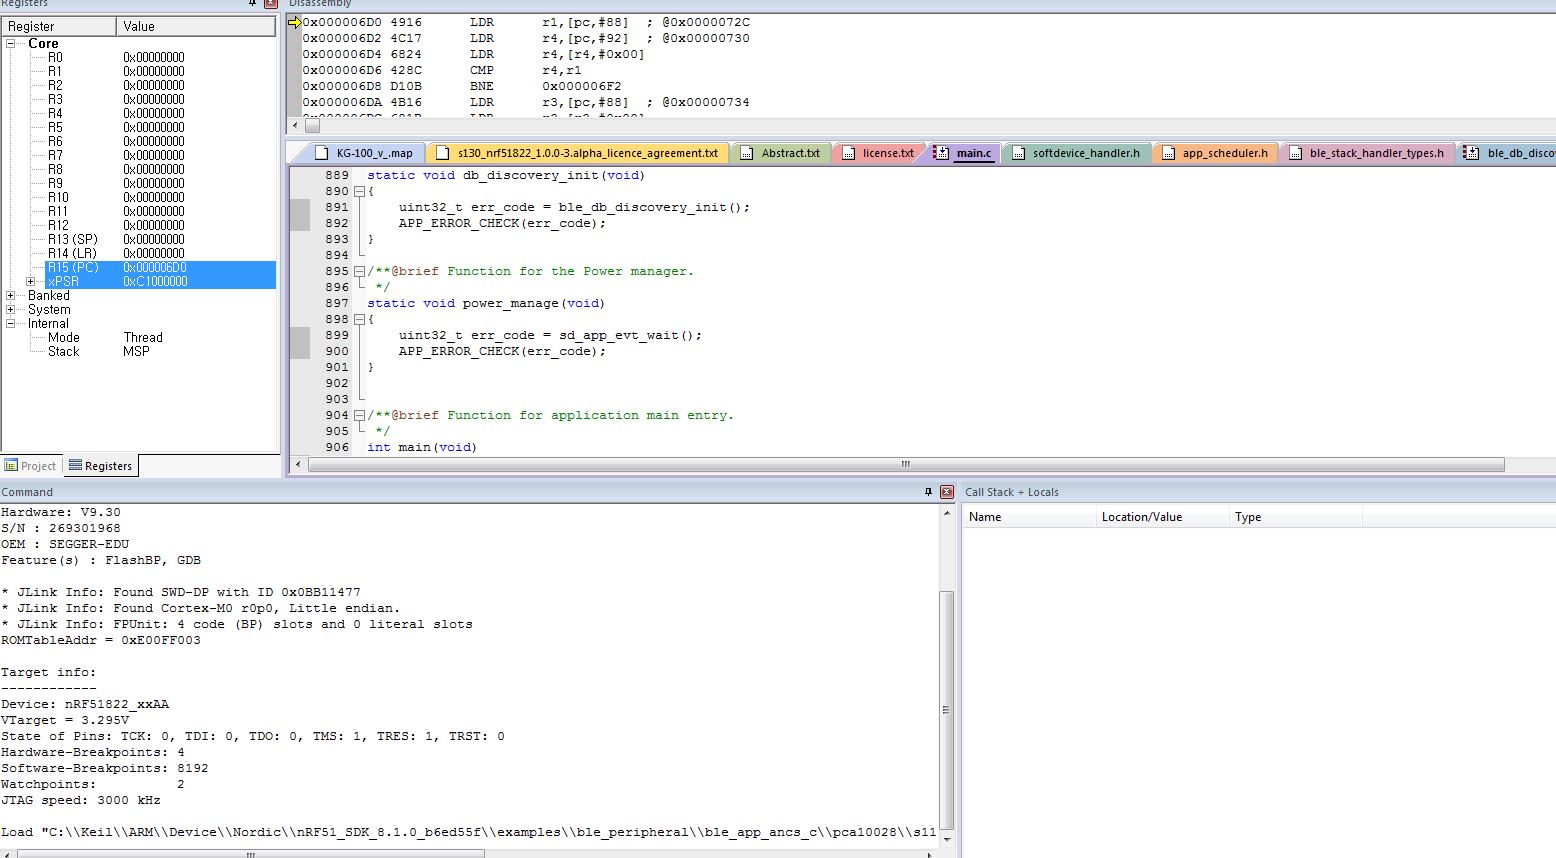
I am trying to develop ANCS device with SDK 8.1, but I have some problem to debug.
This are my environments.
Board: custom board.
chip: nrf51822AA
SDK 8.1
SD 8.0.0
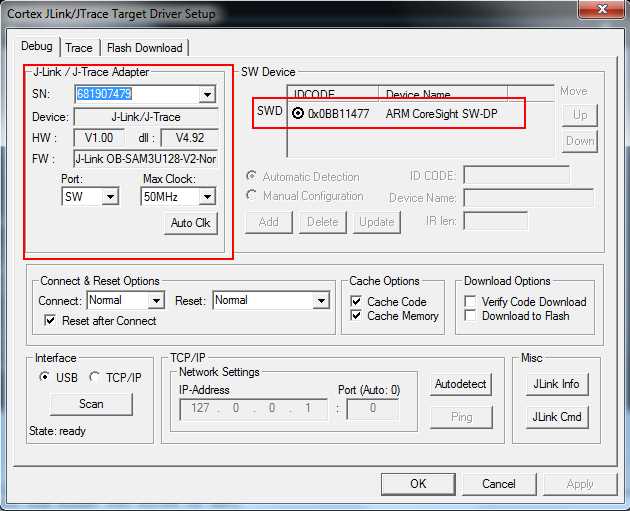
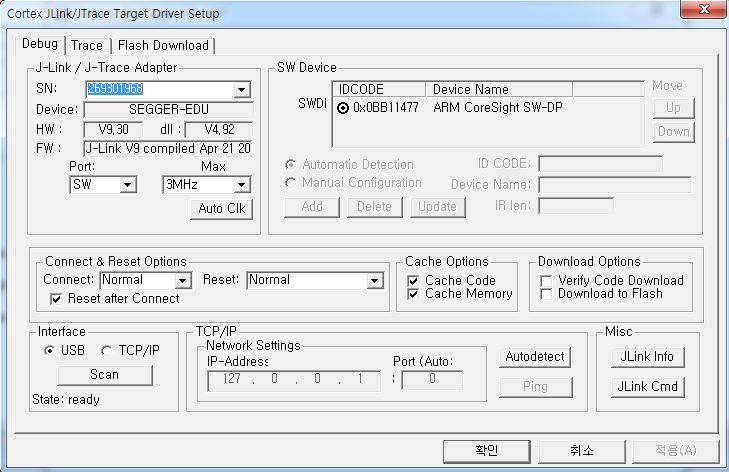
Debugger: J-link EDU
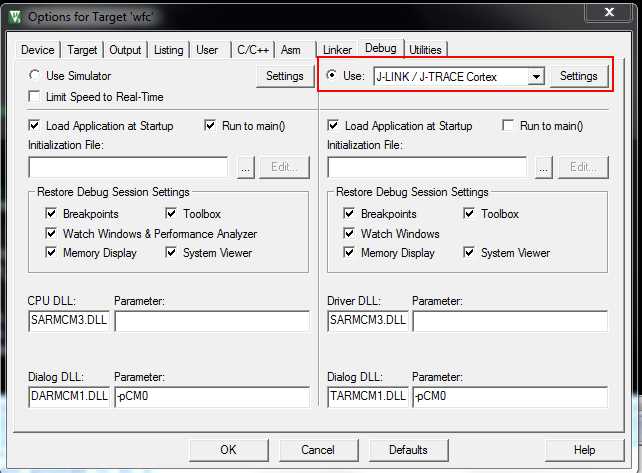
I opened the project ble_app_ancs_s110_pca10028.uvproj
,and I changed follows.
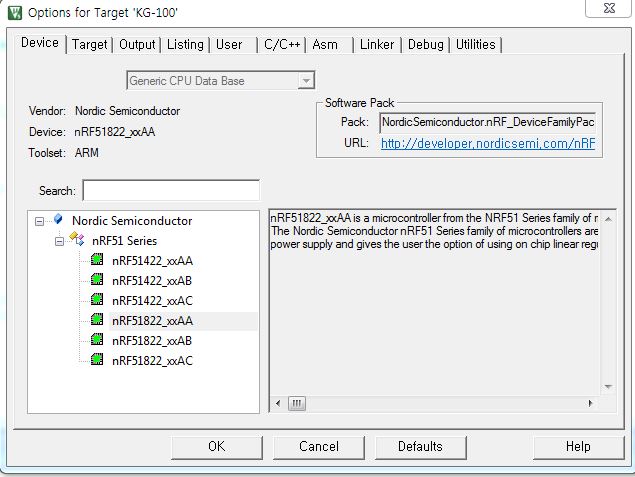
- Device
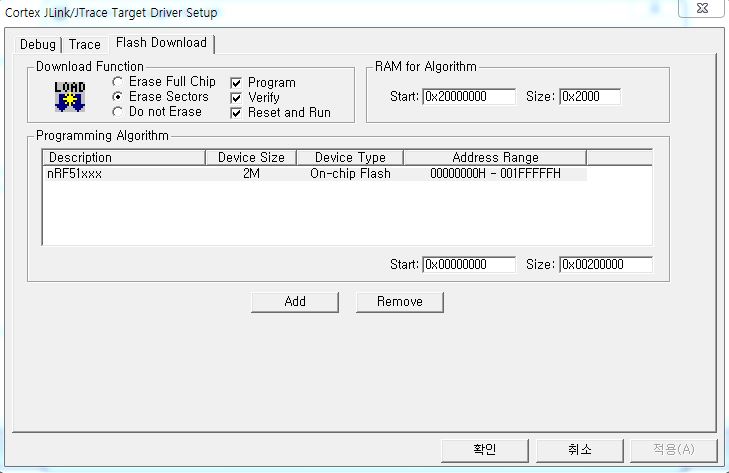
- Memory area
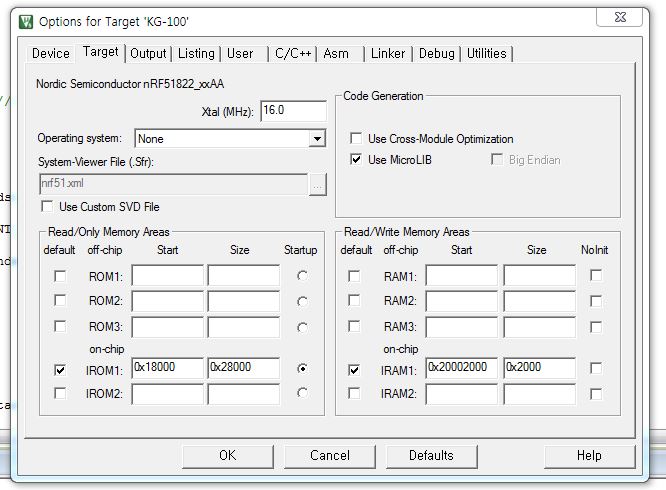
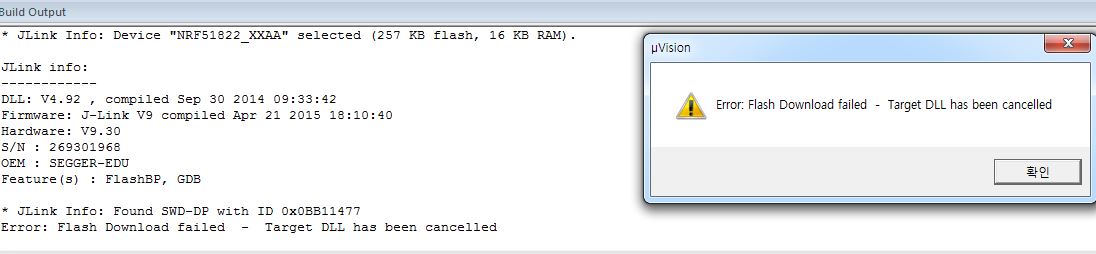
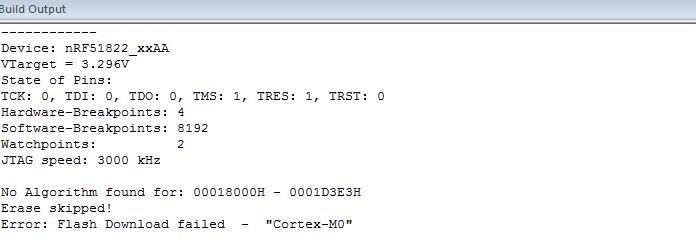
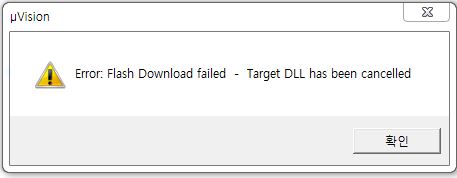
But I can't debug with this message.
I thins this ancs example target is nrf51422 s110 and pca10028.
Is it possible that I use this example with 51822AA chip?