Beware that this post is related to an SDK in maintenance mode
More Info: Consider nRF Connect SDK for new designs
This post is older than 2 years and might not be relevant anymore
More Info: Consider searching for newer posts

Read the time between two lines of code

Hi

I am using app timer in my software and in the timer handler i do multiple things which can take up random amount of time.

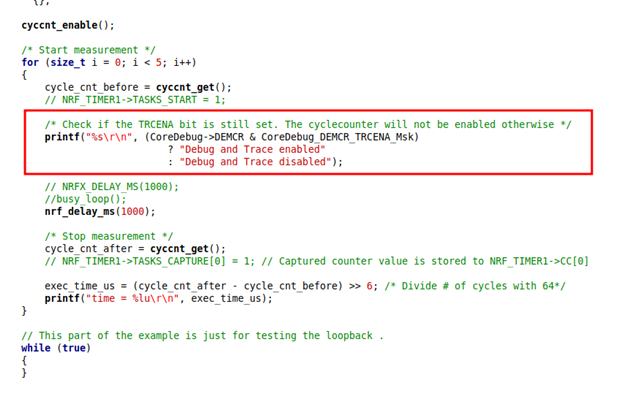
I would like to know the time taken from the start of a line of code to the end of the line of code
I could see that I can use app_timer_cnt_get() and convert the ticks to milliseconds , but I cant seem to find the value at which this app_timer_cnt_ge() function will be overflowed or reset to 0.

Is there any other way to achieve the above mentioned specification?

Thanks

Parents
  • Hi,

    For profiling of exuection time during developement I'd rather recommend using a high frequency TIMER — Timer/counter instance or the built in cycle counter. The app timer library runs off the  32KHz RTC which limits the accuracy.

    Here is a small code snippet showing how you may use a TIMER or cyclecounter for measuring execution time for a code snippet:

    static uint32_t cycle_cnt_before;
    static uint32_t cycle_cnt_after;
    static uint32_t exec_time_us;
    
    uint32_t cyccnt_get(void)
    {
        return DWT->CYCCNT;
    }
    
    uint32_t cyccnt_enable()
    {
        CoreDebug->DEMCR |= CoreDebug_DEMCR_TRCENA_Msk;
        DWT->CTRL |= DWT_CTRL_CYCCNTENA_Msk;
        DWT->CYCCNT = 0;
    }
    
    
    int main(void)
    {
        /* Start 16MHz crystal oscillator for better accuracy (HFXO) */
        NRF_CLOCK->TASKS_HFCLKSTART = 1;
        while (NRF_CLOCK->EVENTS_HFCLKSTARTED == 0)
          {};
        
        cyccnt_enable();
        
        /* Start measurement */
        cycle_cnt_before = cyccnt_get();
        NRF_TIMER1->TASKS_START = 1;
        
        /* Place the code you want to measure the execution time of here */
        
        /* Stop measurement */
        cycle_cnt_after = cyccnt_get();
        NRF_TIMER1->TASKS_CAPTURE[0] = 1; // Captured counter value is stored to NRF_TIMER1->CC[0]
        
        exec_time_us = (cycle_cnt_after - cycle_cnt_before) >> 6; /* Divide # of cycles with 64*/
    }

    Best regards,

    Vidar

  • Hi,

    if I take your example and modify it in the follwoing manner this example is not really wokring:

    static inline void busy_loop(void) {
        volatile size_t foo = 0;
        for (size_t i = 0; i < (UINT32_MAX / 128); i++)
        {
            foo += i;
        }
    }
    
    static uint32_t cycle_cnt_before;
    static uint32_t cycle_cnt_after;
    static uint32_t exec_time_us;
    
    uint32_t cyccnt_get(void)
    {
        return DWT->CYCCNT;
    }
    
    uint32_t cyccnt_enable()
    {
        CoreDebug->DEMCR |= CoreDebug_DEMCR_TRCENA_Msk;
        DWT->CTRL |= DWT_CTRL_CYCCNTENA_Msk;
        DWT->CYCCNT = 0;
    }
    
    
    int p_main(void)
    {
        /* Start 16MHz crystal oscillator for better accuracy (HFXO) */
        NRF_CLOCK->TASKS_LFCLKSTART = 1;
        while (NRF_CLOCK->EVENTS_LFCLKSTARTED == 0)
          {};
        
        cyccnt_enable();
        
        /* Start measurement */
        for (size_t i = 0; i < 5; i++)
        {
            cycle_cnt_before = cyccnt_get();
            // NRF_TIMER1->TASKS_START = 1;
            
            // NRFX_DELAY_MS(1000);
            busy_loop();
            
            /* Stop measurement */
            cycle_cnt_after = cyccnt_get();
            // NRF_TIMER1->TASKS_CAPTURE[0] = 1; // Captured counter value is stored to NRF_TIMER1->CC[0]
            
            exec_time_us = (cycle_cnt_after - cycle_cnt_before) >> 6; /* Divide # of cycles with 64*/
            printf("time = %lu\n", exec_time_us);
        }
    }

    The output would looke something like this:

    time = 404
    time = 0
    time = 0
    time = 0
    time = 0
    

    This is kind of wrong :/. the busy loop is takeing about 1-2 seconds on the nrf52840.

  • Hi,

    Does it work better if you put the chip in Debug Interface mode? You can do so by starting a debug session in your IDE/debugger.

  • Hi,

    yes if I use a debuger to execute the example it works. Is there a way to achieve this without a debugger attached?

Reply Children
  • I will have to check internally and get back to you. I suspect the module is powered down when not in debug interface mode, but maybe there is a way to force it on.

  • Hi,

    I found the problem after a bit more testing. What happens is that the TRCENA bit written in cyccnt_enable() gets cleared when the debugger forces the chip out of Debug Interface mode. For instance, after programming of the app is complete. As you might guess, this will disable the cycle counter. Though only if it happens after the cyccnt_enable() function has been run by your app.

    You can do a power cycle, pinreset, etc after programming your test app to confirm this on your side.

    printf I added to monitor the TRCENA status:

    And the expected log output if you test with the same code snippet:

    time = 1000810
    Debug and Trace enabled
    time = 1000667
    Debug and Trace enabled
    time = 1000841
    Debug and Trace enabled
    time = 1000841
    Debug and Trace enabled
    time = 1000841
    Debug and Trace enabled
    time = 1000841

Related