
Hello,
I understand that SES has a built in debugger functionality, but would like to implement debugging on VSCode using Cortex-Debug for a better workflow. I am experimenting with the blinky peripheral example, and have tried both the SDK3.2 version (on a rev 1.1.0 board), and the SDK4.1 version (on a rev 2.0.1 board).
Taking from the segger wiki page and slightly modifying the code, I have implemented the below code for my .vscode/launch.json file:
{
    // Use IntelliSense to learn about possible attributes.
    // Hover to view descriptions of existing attributes.
    // For more information, visit: https://go.microsoft.com/fwlink/?linkid=830387
    "version": "0.2.0",
    "configurations": [
        {
            "name": "Cortex Debug",
            "cwd": "${workspaceFolder}",
            "executable": "pca10056/blank/armgcc/_build/nrf52840_xxaa.out",
            "serverpath": "C:/Program Files (x86)/SEGGER/JLink/JLinkGDBServerCL.exe",
            "request": "launch",
            "type": "cortex-debug",
            "servertype": "jlink",
            "device": "nrf52",
            "interface": "swd",
            "armToolchainPath": "C:/Program Files (x86)/GNU Tools ARM Embedded/7 2018-q2-update/bin/"
        }
    ]
}
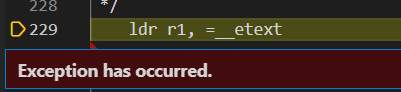
Having written the launch.json, I run the cortex-debug debugger, and there is an immediate exception that is thrown, as seen below. The line seems to relate to the copying of information from ROM to RAM based off the __etext LMA.
Below is the debugger console. Also find attached the output text.
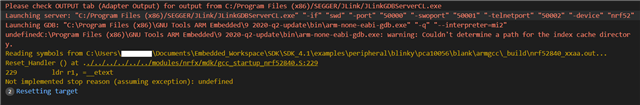
SEGGER J-Link GDB Server V6.88a Command Line Version

JLinkARM.dll V6.88a (DLL compiled Nov 18 2020 15:09:23)

Command line: -if swd -port 50000 -swoport 50001 -telnetport 50002 -device nrf52
-----GDB Server start settings-----
GDBInit file:                  none
GDB Server Listening port:     50000
SWO raw output listening port: 50001
Terminal I/O port:             50002
Accept remote connection:      localhost only
Generate logfile:              off
Verify download:               off
Init regs on start:            off
Silent mode:                   off
Single run mode:               off
Target connection timeout:     0 ms
------J-Link related settings------
J-Link Host interface:         USB
J-Link script:                 none
J-Link settings file:          none
------Target related settings------
Target device:                 nrf52
Target interface:              SWD
Target interface speed:        4000kHz
Target endian:                 little

Connecting to J-Link...
J-Link is connected.
Firmware: J-Link OB-SAM3U128-V2-NordicSemi compiled Mar 17 2020 14:43:00
Hardware: V1.00
S/N: 683955663
Feature(s): RDI, FlashBP, FlashDL, JFlash, GDB
Checking target voltage...
Target voltage: 3.30 V
Listening on TCP/IP port 50000
Connecting to target...
Connected to target
Waiting for GDB connection...Connected to 127.0.0.1
Reading all registers
Read 4 bytes @ address 0x000002BC (Data = 0x4A074906)
Read 2 bytes @ address 0x000002BC (Data = 0x4906)
Received monitor command: halt
Halting target CPU...
...Target halted (PC = 0x000002BC)
Received monitor command: reset
Resetting target
Downloading 1584 bytes @ address 0x00000000
Downloading 8 bytes @ address 0x00000630
Downloading 108 bytes @ address 0x00000638
Received monitor command: reset
Resetting target
Read 4 bytes @ address 0x000002BC (Data = 0x4A074906)
Read 2 bytes @ address 0x000002BC (Data = 0x4906)
Reading register (MSP = 0x20040000)
Reading register (PSP = 0x       0)
Reading register (PRIMASK = 0x       0)
Reading register (BASEPRI = 0x       0)
Reading register (FAULTMASK = 0x       0)
Reading register (CONTROL = 0x       0)
Reading register (FPSCR = 0x       0)
Reading register (s0 = 0x       0)
Reading register (s1 = 0x       0)
Reading register (s2 = 0x       0)
Reading register (s3 = 0x       0)
Reading register (s4 = 0x       0)
Reading register (s5 = 0x       0)
Reading register (s6 = 0x       0)
Reading register (s7 = 0x       0)
Reading register (s8 = 0x       0)
Reading register (s9 = 0x       0)
Reading register (s10 = 0x       0)
Reading register (s11 = 0x       0)
Reading register (s12 = 0x       0)
Reading register (s13 = 0x       0)
Reading register (s14 = 0x       0)
Reading register (s15 = 0x       0)
Reading register (s16 = 0x       0)
Reading register (s17 = 0x       0)
Reading register (s18 = 0x       0)
Reading register (s19 = 0x       0)
Reading register (s20 = 0x       0)
Reading register (s21 = 0x       0)
Reading register (s22 = 0x       0)
Reading register (s23 = 0x       0)
Reading register (s24 = 0x       0)
Reading register (s25 = 0x       0)
Reading register (s26 = 0x       0)
Reading register (s27 = 0x       0)
Reading register (s28 = 0x       0)
Reading register (s29 = 0x       0)
Reading register (s30 = 0x       0)
Reading register (s31 = 0x       0)
Reading register (d0 = 0x       0)
Reading register (d1 = 0x       0)
Reading register (d2 = 0x       0)
Reading register (d3 = 0x       0)
Reading register (d4 = 0x       0)
Reading register (d5 = 0x       0)
Reading register (d6 = 0x       0)
Reading register (d7 = 0x       0)
Reading register (d8 = 0x       0)
Reading register (d9 = 0x       0)
Reading register (d10 = 0x       0)
Reading register (d11 = 0x       0)
Reading register (d12 = 0x       0)
Reading register (d13 = 0x       0)
Reading register (d14 = 0x       0)
Reading register (d15 = 0x       0)
The interesting thing to note is that if I am to ignore the error and continue the normal debug process, there are no immediate issues I can find and the running of the debugger operates just fine. However , I am running a very simple blinky.c program, so I am not sure if there will be problems down the line upon using more complex code.
Could you please advise if this is normal behavior and nothing to worry about, or if there is some error in the way I am trying to implement debugging.
Thank you,
Angry Oatmeal.

