This post is older than 2 years and might not be relevant anymore
More Info: Consider searching for newer posts

Average connection latency for nRF52840

Hi, 

I'm trying to collect data for average latency for nRF52840 using an Android Smartphone as Central and nRF as peripheral.

Latency is being measured by the Android App developed. Latency in my application is defined as the period from when the Android App started scanning until it has successfully established a connection with the nRF. After the Android App discovered the address of the nRF, it will stop scanning and then tries to connect to it.

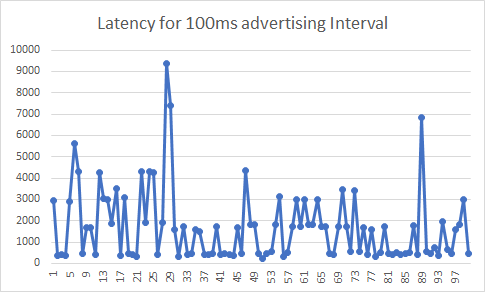
Prior connection, nRF is always advertising at 100ms advertising interval. I'm quite surprised that I get measurements with a very large variation. From min = 249ms to max = 9376ms with an average of 1672.17ms. Are these values expected? Or they are too long for the configured advertising interval which is 100ms?

Y axis : Latency in ms

X axis : Trials

Kind regards,

Erick

  • Hello Erick,

    johnnyR said:
    Yes im familiar with the nRF Sniffer, we've used that a lot to monitor the traffic.

    Great!

    johnnyR said:
    But Im afraid, selecting the peripheral device wouldn't expose the connect_request packet sent by the smartphone, we would only see the advertisements broadcasted by the peripheral, hence, we still wouldnt find out if there are missed or failed connect requests. Are there other ways to do this? 

    If you have selected the peripheral device, you will see both inbound and outbound communication for that device. So, you will initially only see its advertisements, and the occasional stray scan request and response, and you should also see incoming connect requests.
    Have you tried this, and are you not seeing the connect request come in?

    Please try this, and let me know if you do not see the connect request packet in the sniffer.

    Best regards,
    Karl

Related