This post is older than 2 years and might not be relevant anymore
More Info: Consider searching for newer posts

strange power profile from power-on vs. debugger

Hello,

I just receive a PPK2 and looking at power usage/profile. Below is the captured profile when the application is run from the debugger and then detached. This captures the difference in power when transitioning from fast to slow advertising.
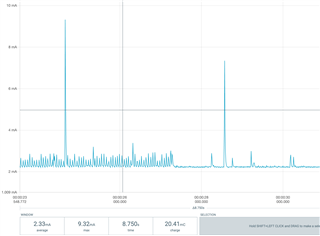
This is the same period of time when going from fast to slow advertising. The only difference is that the power was turned off and on from the PPK2 to start execution.
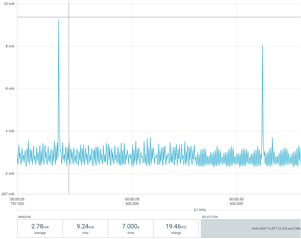
The higher frequency signal at the baseline of slow advertising is very strange.

Can anyone explain what I am seeing?

TIA

Allen

Parents
  • Hi Allen, 
    Could you export the trace and send us ? 
    We experienced that the PPK2 has some incompatible issue with AMD Ryzen mainboard/CPU. And found that if you connect the PPK2 to a USB hub it can give more stable result. 

    I would suggest to test with very simple application, for example just sleep and wake up to toggle GPIO with a RTC timer.  So that we make sure we can get to the base sleep current. 

  • Hello,

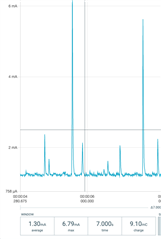
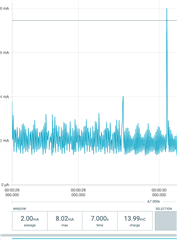
    My computer is an iMac with an Intel i7. And the PPK is connected via a hub. See the images below. The base current is 1.3mA. I am pretty sure sleep is working.

    Is there any place in the processor startup code that differs when run with the debugger? I am not sure what to look for.

  • Hi Allen, 

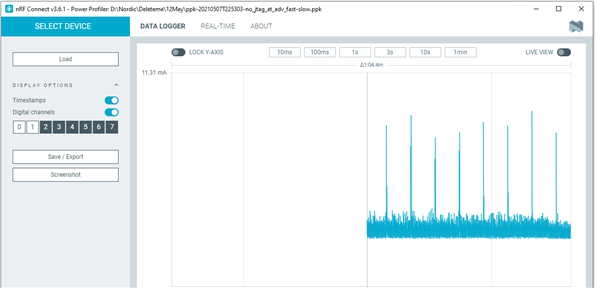
    Could you send us the trace ? Preferably with some BLE activity. You can test using the ble_app_pwr_profiling. 
    When you connect the debugger (and you actually run the debugger) the HFCLK will be kept running and it might explain why you see higher current. And the CPU wouldn't enter sleep mode as it should. 
    The base current when sleeping (System ON CPU Idle) should be around 2-3 uA (not mA). 

  • Hello H,

    The concern is not the current draw when the debugger is attached. All the plots provided are the the debugger "detached". The only difference is that in the first plot, the program was started using the debugger. The second graph, is a normal power-on startup. Because of the noise, the power is higher in the power-on scenario.

Reply Children
Related