This post is older than 2 years and might not be relevant anymore
More Info: Consider searching for newer posts

Wierd hardfault

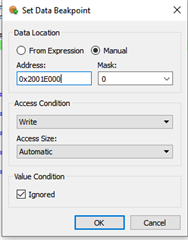
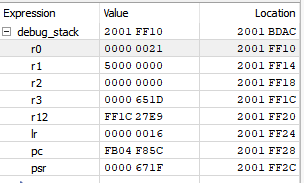
I have a bit of an odd one, and would appreciate any input.  We have a fairly complex project, which does various things, but some of the time, I get a hardfault.  The issue appears to be a instruction access violation (MMFSR->IACCVIOL = 1).  Working backwards, the code that caused this seems to be the nrfx_coredep_delay_us function (in nrfx_coredep.h).

We're using the 17.0.2 SDK, and the code in question is this, and the PC points to delay_machine_code:

   __ALIGN(16)
    static const uint16_t delay_machine_code[] = {
        0x3800 + NRFX_COREDEP_DELAY_US_LOOP_CYCLES, // SUBS r0, #loop_cycles
        0xd8fd, // BHI .-2
        0x4770  // BX LR
    };

    typedef void (* delay_func_t)(uint32_t);
    const delay_func_t delay_cycles =
        // Set LSB to 1 to execute the code in the Thumb mode.
        (delay_func_t)((((uint32_t)delay_machine_code) | 1));
    uint32_t cycles = time_us * NRFX_DELAY_CPU_FREQ_MHZ;
    delay_cycles(cycles);

I wasn't entirely sure about the way the code is hand-loaded in, so I tried switching to using the DWT instead (since the 53833 supports that).  This produced the same hardfault behaviour, only now it's on

while ((DWT->CYCCNT - cyccnt_initial) < time_cycles)
    {}

I suspect there's something else going on here.  Our code does use nrf_delay_ms for certain things that need busy waits, which calls through to the above code, but it only hardfaults some of the time.  As above, we're using SDK 17.0.2, nrf52833 on a custom board.

I'm at a bit of a loss on this one, suggestions welcome?

Parents Reply Children
  • Hi Alison,

    I don't think there is anything that points directly to the FPU at this point, but it may be related (e.g. contribute to a stack overflow). Could you maybe try with our HardFault handling library and see if it too points to the same address (i.e. PC value on stack)? The ARM documentation indicates that this fault doesn't neccessarly require the MPU to be enabled.

  • Hi Vidar,

    I've pulled in the Nordic hardfault library, which doesn't seem to point to a stack overrun directly - if I understand correctly, the call to HardFault_process() should pass NULL if it's a stack overrun, and that doesn't seem to be happening.  I get a valud pointer to a debug stack.

    Some quick calculations: this project has a stack size of 8192 bytes (8k), which given RAM starts at 0x20000000, should give a stack placement of 0x2001E000 to 0x20020000 (128kB RAM).  At the point of the hardfault, according to Ozone, the SP (R13) is pointing to 0x2001FF28, which should still be a legal bit of stack.  It's getting close to the edge, mind, which is concerning, but not actually over.

    The pointer the Nordic hardfault library gives me is 0x2001FF80, so a little higher than where Ozone says the SP is, which seems reasonable - I guess it's pointing a little higher up the call chain.

    Unfortunately, we're really tight for RAM in this project, hence the 8kB stack.  This means I can't easily bump up the stack to see if the problem goes away.  Does this look like stack overrun issues, based on the above, or should we hunt elsewhere?

  • Hi,

    Your understanding is correct, the pointer will be set to NULL if there is a stack overflow, but only if there is a stack overflow while the hardfault exception is raised. And a stack overrun doesn't necessarily trigger a fault immediately (if at all). To catch a stack overflow early you can use the Stack guard library or try to set a data breakpoint at the bottom of the stack.

    Setting data breakpoint in Ozone

    Did the hardfault handler print the debug messages? It would be interesting to see the CPU register values that were pushed on stack before the hardfault exception.

  • Hi Vidar,

    Unfortunately, having any sort of debugger attached while running prevents the hardfault showing up at all, which would tend to suggest some sort of timing issue.  Using a UART has the same effect.  I can attach to the running chip after the hardfault has happened, to see the state of things, but I can't watch the fault happen (which also means not getting the debug output).

    The stack frame passed to my HardFault_process function looks like this:

    And the CPU registers (according to Ozone) are:

    As the stack guard library uses the MPU, wouldn't it basically show the same symptom, i.e. an instruction access violation, if the stack was triggered? 

    I've had a go at the old-fashioned "write DEADBEEF to the stack at start-up" method, and that suggests that this code isn't actually over-running the stack.  At the point a hardfault has ocurred, connecting after the fact via Ozone shows that 0x2001E000 is all DEADBEEF still.  I've also confirmed again via MPU_CTRL that the MPU definitely doesn't think it's enabled.

    So, all in all, it doesn't look like stack overflow is the issue here.  Which brings us back to a wierd hardfault that doesn't seem to have any obvious cause, but occurs repeatably.

  • Hi,

    I agree, it doesn't sound like you have had stack overflow, but the PC value (0xFB04F85C) on stack is clearly invalid, so that must be the reason for the hardfault.

    It's intereseting that you're not able to replicate this in debug mode. Have you tried to comment the sleep/idle function in your application to see if that may have the same effect as being in debug mode?

Related