This post is older than 2 years and might not be relevant anymore
More Info: Consider searching for newer posts

nRF52840 Dongle working as RCP which attached to a OTBR sometimes doesn't ACK child's IEEE802.15.4 Data Request packet

The Topology:

There are only two devices in the topoloty: One nRF52840 dongle attached to a ubuntu laptop who works as an OTBR,  the other nRF52840 dongle as a FTD device with thread mode 'n'. 

Of course there is a third party device working as the sniffer.

The RCP/FTD are build from https://github.com/openthread/ot-nrf528xx.git with commit - 5c86d0c8

FTD configuration: channel 16; panid 0xabcd; networkkey xxx; mode n; childtimeout 10

The symptom:

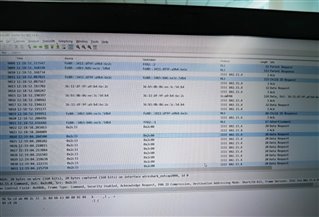
The RCP doesn't ACK child's IEEE802.15.4 Data Request packet from both the sniffer and the FTD device's behavior.

Some analysis:

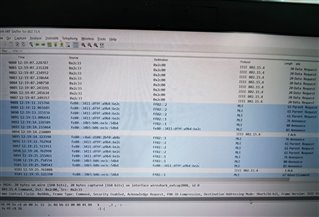
The sniffer: we saw a lot of Data Request packet from the child are sent out (because of re-transmission mechanic due to no ACK replay), yet no ACK received.

                   After sometimes, the child sent "parent request" MLE packets. yet the OTBR doesn't reply until some time later.

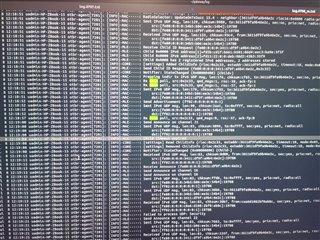
The OTBR: from the OTBR log, it actually didn't receive any "Rx data poll" from the RCP.

The Child: The child retransmit a lot of Data Request, after timeout, it try to re-establish the link with its parent (correct behavior).

Some guessing:

The RCP radio state may be stuck, hence it didn't receive packets for some times, until some other event trigger the radio state back to normal (for example, when the OTBR try to send out some packet from the RCP and that packet requires some ACK from the child.)

  • Dear Charlie:

       Thank you for your verification. There maybe some differences between our setup. 

    1. OTBR: (RPI4+nRF52840Dongle as RCP) with both OTBR and RCP to be rebuild versions from latest github.

    2. Sniffer: Ubuntu+ Wireshark + nRF52840Dongle as RCP

    3. Joiner: nRF52840DK running CLI as a joiner. There are two DK or USB dongle board function as joiner, with additional configuration:   

                      mode n

                      childtimeout 15

    Then you will easily find that there are lots of Data Request and ACK pairs, also with lots of Data Requests without ACKs.

    Please help to verify and fix.

    Thanks,

    Yours.

  • Hi ThreadApp,

    Is there any special reason you need to set child timeout to 15? The default value is 240.

    Best regards,

    Charlie 

  • Dear Charlie,

       Just to speed up the appearance of the bad situation.

    Thanks

  • Hi ThreadApp,

    I try the following process to recreate your issue, but it did not appear. Here are the steps and logs.

    1. Prepare devices.

    OTBR-RCP:

    open one terminal to log the otbr-agent service:

    journalctl -u otbr-agent.service -f

    open another terminal:

    pi@raspberrypi:~ $ sudo ot-ctl thread stop
    Done
    pi@raspberrypi:~ $ sudo ot-ctl childtimeout
    240
    Done
    pi@raspberrypi:~ $ sudo ot-ctl childtimeout 15
    Done
    pi@raspberrypi:~ $ sudo ot-ctl dataset active
    Active Timestamp: 1
    Channel: 12
    Channel Mask: 0x07fff800
    Ext PAN ID: dead1111dead2222
    Mesh Local Prefix: fdc0:ea9c:b547:d139::/64
    Master Key: 11112233445566778899dead1111dead
    Network Name: OpenThreadGuide
    PAN ID: 0xdead
    PSKc: 198886f519a8fd7c981fee95d72f4ba7
    Security Policy: 672 onrcb
    Done

    Joiner:

    > thread stop
    Done
    > eui64
    f4ce363f50876xxx
    Done

    Sniffer:

    Run Wireshark with following command:

    sudo python sniffer.py -c 12 2 -u /dev/ttyACM1 --crc --rssi -b 460800 | wireshark -k -i -

    2. Form Thread network and commission Joiner.

    OTBR-RCP:

    pi@raspberrypi:~ $ sudo ot-ctl thread start
    Done
    pi@raspberrypi:~ $ sudo ot-ctl state
    leader
    Done
    pi@raspberrypi:~ $ sudo ot-ctl ipaddr
    fd04:3a9b:cb7c:66c4:a79c:8fb1:6c2d:4b12
    fdc0:ea9c:b547:d139:0:ff:fe00:fc11
    fdc0:ea9c:b547:d139:0:ff:fe00:fc38
    fdc0:ea9c:b547:d139:0:ff:fe00:fc10
    fdc0:ea9c:b547:d139:0:ff:fe00:fc00
    fdc0:ea9c:b547:d139:0:ff:fe00:6400
    fdc0:ea9c:b547:d139:12db:d3e2:e714:ff37
    fe80:0:0:0:2ca6:6318:555e:2127
    Done
    

    Joiner:

    Use Thread Group Android App to commission Joiner device into the network.

    > ifconfig up
    Done
    > joiner start J01NU5
    Done
    > Join success
    
    > thread start
    Done
    > state
    child
    Done
    > state
    router
    Done
    fdc0:ea9c:b547:d139:0:ff:fe00:f400
    fdc0:ea9c:b547:d139:e84a:9ceb:1831:512f
    fe80:0:0:0:302e:71a5:1592:884c
    fd04:3a9b:cb7c:66c4:dded:7966:66bd:65d
    Done

    3. Ping Joiner from OTBR.

    pi@raspberrypi:~ $ ping fdc0:ea9c:b547:d139:e84a:9ceb:1831:512f
    PING fdc0:ea9c:b547:d139:e84a:9ceb:1831:512f(fdc0:ea9c:b547:d139:e84a:9ceb:1831:512f) 56 data bytes
    64 bytes from fdc0:ea9c:b547:d139:e84a:9ceb:1831:512f: icmp_seq=1 ttl=64 time=54.4 ms
    64 bytes from fdc0:ea9c:b547:d139:e84a:9ceb:1831:512f: icmp_seq=2 ttl=64 time=16.7 ms
    64 bytes from fdc0:ea9c:b547:d139:e84a:9ceb:1831:512f: icmp_seq=3 ttl=64 time=15.4 ms
    64 bytes from fdc0:ea9c:b547:d139:e84a:9ceb:1831:512f: icmp_seq=4 ttl=64 time=16.6 ms
    64 bytes from fdc0:ea9c:b547:d139:e84a:9ceb:1831:512f: icmp_seq=5 ttl=64 time=14.8 ms
    64 bytes from fdc0:ea9c:b547:d139:e84a:9ceb:1831:512f: icmp_seq=6 ttl=64 time=16.6 ms
    ^C
    --- fdc0:ea9c:b547:d139:e84a:9ceb:1831:512f ping statistics ---
    6 packets transmitted, 6 received, 0% packet loss, time 13ms
    rtt min/avg/max/mdev = 14.790/22.440/54.430/14.325 ms
    

    Here are the logs from Wireshark and otbr-agent service.

    0361.wireshark_sniffer.pcapng 3580.otbr-agent_log.txt

    Please let me if there are any differences between our experiments.

    Best regards,

    Charlie

Related