This post is older than 2 years and might not be relevant anymore
More Info: Consider searching for newer posts

when the SoftDevice Event rise SD_EVT_IRQ in Central Role? What's connect timing mode for multi-link in Central Role?

Hi:

    We are develop an Central Device can Connect 8 BLE Device in same time. and want max throughout. it use queue and freeRTOS.  the Central TX is simple.

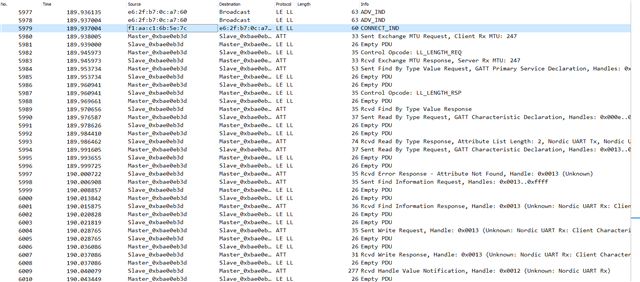
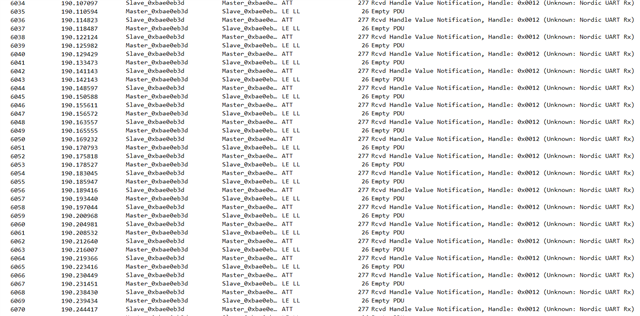
    use  sd_ble_gattc_write() with BLE_GATT_OP_WRITE_CMD to write.  wait semaphore event rise by BLE_GATTC_EVT_WRITE_CMD_TX_COMPLETE event. 

   but between the SD_EVT_IRQ interrupt rise(BLE_GATTC_EVT_WRITE_CMD_TX_COMPLETE ) and sd_ble_gattc_write, it  take about 7.5ms. not our expect 2.5ms(1Mbps) or 1.4ms(2Mbps).  When SD_EVT_IRQ interrupt rise by SoftDevice?  why it same value as NRF_BLE_SCAN_MIN_CONNECTION_INTERVAL ? 

Is NRF_SDH_BLE_GAP_EVENT_LENGTH  use to reduce SD_EVT_IRQ  frequency?  Do the Nordic Semiconductor have guidebook for these config parameters? or have excel document can calculate these parameters?

   how the SoftDevice handle Multi-linked peripheral connect timing? 

   from "Connection timing as a Central" charter of S140_SDS_v2.1,  Do SoftDevice use one Big time Slot to scan each connected peripheral? each peripheral get equalization chance?

|  peripheral 1 connect timing(7.5ms) | peripheral 2 connect timing(7.5ms)  | .... | peripheral 8connect timing(7.5ms)|   --> Next loop

|_____________________________|_____________________________|_______________________________|

   or just each peripheral has random shift start connect timing? 

           |  peripheral 1 connect timing(7.5ms) |

                |  peripheral 2 connect timing(7.5ms) |

                 .....

                     | peripheral 8connect timing(7.5ms)| 


Here the Central Config:

#define NRF_SDH_BLE_GAP_DATA_LENGTH 251

#define NRF_SDH_BLE_PERIPHERAL_LINK_COUNT 0

#define NRF_SDH_BLE_CENTRAL_LINK_COUNT  8

#define NRF_SDH_BLE_TOTAL_LINK_COUNT    8

#define NRF_SDH_BLE_GAP_EVENT_LENGTH 6

#define NRF_SDH_BLE_GATT_MAX_MTU_SIZE 247

#define NRF_BLE_SCAN_MIN_CONNECTION_INTERVAL 7.5

the "Connection Event Length Extension" is enabled.  and connect peripheral use min_conn_interval=max_conn_interval=7.5ms.  peripheral use  BLE_GATT_CHAR_PROPERTIES_WRITE_WITHOUT_RESPONSE/BLE_GATT_CHAR_PROPERTIES_NOTIFY.

  • Hello, 

    wen jin zhang said:
    Yes, we used the default value 1.  We only found can change hvn_tx_queue_size  of GATT Server  and write_cmd_tx_queue_size for GATT client. all the for transmitter.  Why No for Receiver?

    What do you mean by this? By transmitter, I assume you mean the server, and by receiver you mean client, is that so?
    write_cmd_tx_queue_size is the configuration for the number of write without response commands that can be queued for the client, in the same way that hvn_tx_queue_size is used to configure the number of notifications that the server can queue for sending.

    wen jin zhang said:
    we change hvn_tx_queue_size  = 3, write_cmd_tx_queue_size  =3, but still only get 32KB/s == 256kbps.

    Do you still get the NRF_ERROR_RESOURCES with this configuration?
    With a queue size of 3 you will only be able to queue 3 notifications for sending each connection interval.
    Using the Online Power Profiler you can see that the sending of 3 such notifications would take around 2 ms to send. This means that you are using far from the full 7.5 ms interval to send packages.

    wen jin zhang said:
    the Device GATTS feed data as far as possible. same ATT MTU =247, Data Length=251.

    What is your connection event length configured to? Have you enabled DLE? To increase throughput you can increase connection event length in order to let the device use more of the time between connection events for sending data.
    Are you familiar with the nRF Sniffer? It is a powerful tool to wield when developing BLE applications. It would be very helpful to see a sniffer trace of the communication happening here, in order to pinpoint why you are not getting the expected throughput.

    Best regards,
    Karl

  • Sorry for my poor English. 

    About 1st my said,  I mean: the SoftDevice seem only support send queue.  both the GATTS and GATTC.  Why does Not SoftDevice  also support receive queue? if yes. the SoftDevice can receive data before Application handle the BLE_GATTC_EVT_HVX Event completely.

    About 2nd my said, answer:  No NRF_ERROR_RESOURCES  error because we handle BLE_GATTC_EVT_WRITE_CMD_TX_COMPLETE event track free queue size.

    about 3rd my said, NRF_SDH_BLE_GAP_EVENT_LENGTH == 6.  here the sniffer info.

  • Hello again,

    I am sorry for the delay in answering. I have been out of office for some time, but now I am back. 

    wen jin zhang said:
    Sorry for my poor English. 

    No need to apologize - I am just making sure that I am understanding your issues and questions correctly.

    wen jin zhang said:
    I mean: the SoftDevice seem only support send queue.  both the GATTS and GATTC.  Why does Not SoftDevice  also support receive queue? if yes. the SoftDevice can receive data before Application handle the BLE_GATTC_EVT_HVX Event completely.

    No, there does not exist any such rx hvn queue, since the application can pull and handle these events while the next notification is incomming.
    When the radio is either in RX or TX all high-priority SoftDevice interrupts are disabled, which should leave enough time for the application to pull and handle the previous HVN while the radio is receiving the next one.

    wen jin zhang said:
    About 2nd my said, answer:  No NRF_ERROR_RESOURCES  error because we handle BLE_GATTC_EVT_WRITE_CMD_TX_COMPLETE event track free queue size.

    Great, I am happy to hear that you resolved the NRF_ERROR_RESOURCES issue!

    wen jin zhang said:
    about 3rd my said, NRF_SDH_BLE_GAP_EVENT_LENGTH == 6.  here the sniffer info.

    I am glad to see that you now have the sniffer tool up and running, great!
    Could you share the complete sniffer trace file instead of screenshots? This would be very helpful since it enables me to see 'the full picture'. 
    Right now, I am unable to see how many notifications that are fit into each event, since I neither see the delta time nor connection event number column.

    Again I apologize for the long delay in answers to this ticket.

    Best regards,
    Karl

  • Great, thank you for sharing the full trace.

    From the trace it seems that you are sending either 1 or 1.5 notifications per connection event. Your connection interval seems somewhat short - are you using 7.5 ms?
    It seems that there occasionally is a burst of notifications that does not fit into the connection event.
    Could you try to double you connection interval and connection event length, and queue, and capture another trace? I would like to see how this affects each connection event.

    Could you also elaborate on how much data you are trying to send each connection event? How often will you be queueing notifications, and how big is your current hvn queue size?
    Right now it seems that the length of the notifications sent in a connection event is not static.

    Best regards,
    Karl

Related