This post is older than 2 years and might not be relevant anymore
More Info: Consider searching for newer posts

Problem with I and Q Samples During the Reference Period of CTE Packets

Hi

As described in this white paper: https://infocenter.nordicsemi.com/pdf/nwp_036.pdf during the reference period of CTE signals, 8 samples are taken. These samples contain both "I" and "Q" elements of signal which has different phases relatively.

I have captured the reported "I" and "Q" samples using the samples provided by SDK:

For the reference period, I can not see any phase difference between "I" and "Q" elements (while it should be different). I have visualized the data and you can see the result in the below images:

IQ samples with 2us switching slots and using PCB antenna:
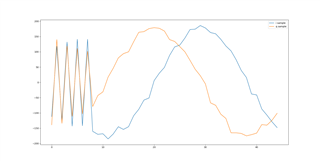
IQ samples with 1us switching slots and using PCB antenna:
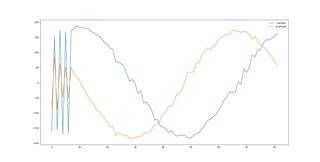
IQ samples with 1us switching slots and using array antenna:
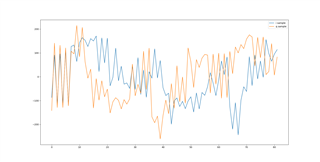

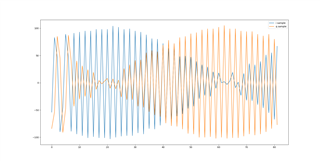
As you can see, in all conditions, the reference period has the similar behavior. I have plotted a third party product which uses the CTE packets and you can see the visualized data here,
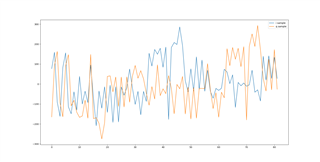
Obviously the "I" and "Q" samples are in different phases during the reference period. What is wrong in the above nRF examples?

Regards,

Saleh

Parents
  • Hello,

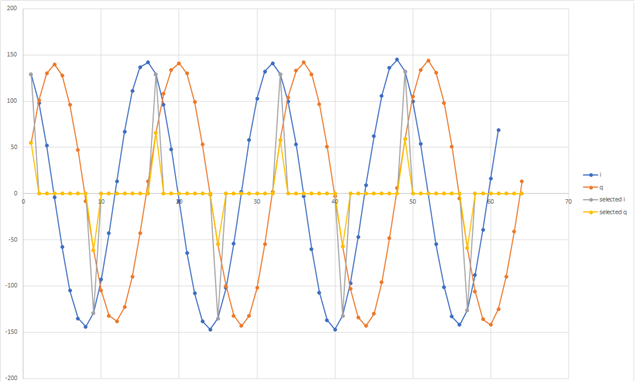
    I've taken a look into the issue. I've made some small custom change to enable oversampling of received CTE. Samples spacing I've used is 125ns instead of 1us that is BT Core spec ref. period spacing.

    Pay attention that samples were collected before preparation to transport through HCI layer. They have different amplitude than what you would observe in application layer. 

    Have a look on the plot below.

    I and Q lines are samples collected every 125ns. Selected I and selected Q are samples you would observe in application (selected every 1us)

    As you can clearly see, the selected I and Q look like there is no PI/2 phase shift between actual I and Q. In reality the shift is there but undersampling makes is not visible. 

  • Thanks a lot Piotr,

    I was working on this issue for three days, there are some comments that I want to share:

    1- Yes, Also I found both transmitter and receiver are working as expected and  there is a phase-shift between "I" and "Q".


    2- The reason that we can not see this phase-shift in the samples, is the frequency offset of CTE signal. when PHY_2M is used, the offset is 500kHz and when PHY_1M is used, it will be 250kHz. By default "PHY_2M" has chosen in Zephyr examples, so the offset of CTE signal is 500kHz.

    According to the sampling frequency during the "reference period" which is done every 1us, the result is not clear enough to see the phase-shift.

    the offset frequency of different physical bitrate has documented in this white paper, page 13: https://infocenter.nordicsemi.com/pdf/nwp_036.pdf


    3- Maybe it is not directly relevant, but as you can see in the above white paper (page 12), it is needed to set the "TSAMPLEOFFSET" in order to read the samples when A/D converter has settled. Now this value is not set and is zero by default.


    4- I changed the physical bit rate to 1M by adding the "BT_LE_ADV_OPT_NO_2M" option to the advertiser parameter of the transmitter:

    static struct bt_le_adv_param param =
    		BT_LE_ADV_PARAM_INIT(BT_LE_ADV_OPT_EXT_ADV |
    				     BT_LE_ADV_OPT_USE_NAME |
    				     BT_LE_ADV_OPT_NO_2M,
    				     BT_GAP_ADV_FAST_INT_MIN_2,
    				     BT_GAP_ADV_FAST_INT_MAX_2,
    				     NULL);

    And now you can see the phase-shift obviously between "I" and "Q" samples.

    Regards,

    Saleh

  • Referring to you comments.

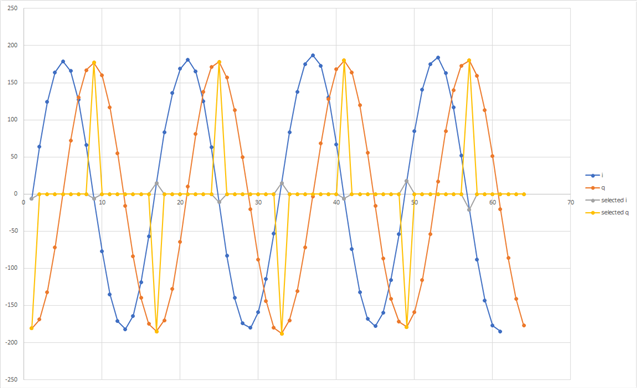
    2. The offset between samples may or may not be visible with PHY_2M. Take a look here:

    The plot presents IQ samples where there is visible offset in selected I and Q. It was produces on IQ data collected with the same FW I've been using to prepare former plot. This one presents IQ data for different CTE.

    In case of PHY_1M, BT Core spec samples spacing in ref. period 1us provides more information for a period of the RF wave, so there is more likely that there won't be the situation with not visible offset between I and Q samples.

    3. TSAMPLEOFFSET offset is a fine-tunig mechanism implemented in DFE. It may introduce better results when applied but it is not necessary. Radio takes samples in appropriate moments at least 125ns after beginning of the sampling slot. 

Reply
  • Referring to you comments.

    2. The offset between samples may or may not be visible with PHY_2M. Take a look here:

    The plot presents IQ samples where there is visible offset in selected I and Q. It was produces on IQ data collected with the same FW I've been using to prepare former plot. This one presents IQ data for different CTE.

    In case of PHY_1M, BT Core spec samples spacing in ref. period 1us provides more information for a period of the RF wave, so there is more likely that there won't be the situation with not visible offset between I and Q samples.

    3. TSAMPLEOFFSET offset is a fine-tunig mechanism implemented in DFE. It may introduce better results when applied but it is not necessary. Radio takes samples in appropriate moments at least 125ns after beginning of the sampling slot. 

Children
Related