Beware that this post is related to an SDK in maintenance mode
More Info: Consider nRF Connect SDK for new designs
This post is older than 2 years and might not be relevant anymore
More Info: Consider searching for newer posts

ppk2 measurements vs online power profiler (nRF52840DK, nRF5 SDK, ble_app_pwr_profiling example)

I'm running the ble_app_pwr_profiling example from the nrf5 SDK (16.0.0) and softdevice (s140 7.0.1)  on a nrf52840DK (pca10056 2.0.1) and measuring power consumption using ppk2.  The measurements rather different from the estimate from the online power profiler.  I'd really like to understand what's going on better.

I run the ble_app_pwr_profiling app (test steps 1 - 10) as described in https://infocenter.nordicsemi.com/topic/sdk_nrf5_v16.0.0/ble_sdk_app_pwr_mgmt.html

The peripheral is an nrf52840DK powered via the ppk2 in source mode.

The default configuration values in main.c are:

#define CONNECTABLE_ADV_INTERVAL MSEC_TO_UNITS(20, UNIT_0_625_MS)
#define APP_CFG_CONNECTION_INTERVAL 20
#define APP_CFG_CHAR_LEN 20

The ppk2 trace clearly shows sequence of three states and the ppk2 reports average current over these events as follows:

1) advertising (push button 1) -- mean current ~950uA, idle current 1.7uA
2) connected (connect via nrfConnect) -- mean current ~277 uA, idle current ~1.2uA
3) notification (toggle notification via nrfConnect) -- mean current ~485uA, idle current ~1.2uA

I enter the same configuration into the online power profiler.

The configuration parameters are: DCDC = off, LF clock = internal RC, TX power = 0dBm (this is ble stack default, correct?)

For the advertising (connectable) role and advertisement interval 20ms, the power profiler gives 591uA mean and 3.1uA idle. The observed values are 950uA and 1.7uA.

For peripheral (connection) role, connection interval 20ms and payload 20B, the power profiler gives 420uA mean and 3.1uA idle.  The observed values are 485uA and 1.2uA.  The log at the central show that notifications are received correctly, at intervals between 18 and 25ms (there is some ongoing BLE and other interference, but not unreasonable amounts).

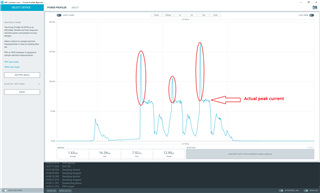
Overall, the peak currents seem to be noticeably higher than those predicted by the profiler (~17mA vs 12mA).  There also seems to be some additional radio activity(?), see detailed traces below.

These differences seem large enough to be noteworthy?   Bonus question: what is the periodic behavior while the peripheral is connected, but not sending notification?

Below are the detailed traces from each measurements.  They are similar to those proposed by the profiler (I don't see an easy way to cut/paste from there), but the peak currents are significantly higher and the notification appears to include an ack (?) that does not appear in the profiler?

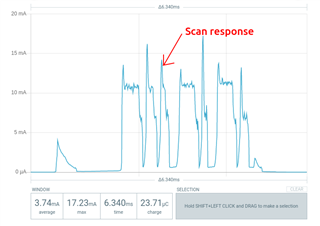
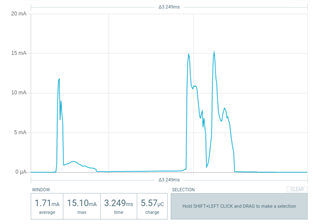
Advertising (measured average 950uA vs 591uA for 20ms interval)

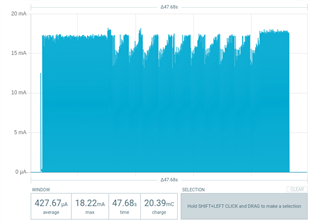
Connected (measured average 277uA, 20ms connection interval)

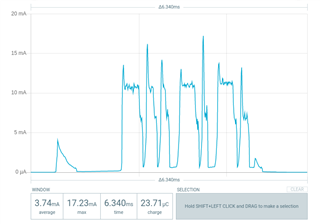
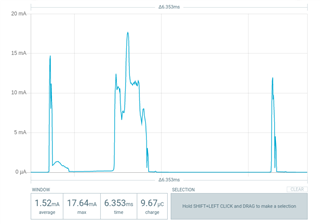
Notification 20ms connection interval, 20B TX payload (measured average 485uA vs 420uA profiled).  Note the ACK (?) that follows the transmission is not seen in the profiler outpur.  (It's also strange, since notification shouldn't have an application layer ack -- it's not an indication.)

Any thoughts about what I'm observing?  Should I be concerned about the discrepancies?

Thanks!

Additional configuration:

nrf52840DK switches:  SW6 = nrf only, SW8 = ON, SW10 = Vext->nrf, USB connected on J2

ppk2 settings:  source mode, 3.0V output (2.98V measured)

power:  ppk2, nrf52840DK and laptop are all connected to a powered USB hub.

software: The ble_app_pwr_profiling app was built from the command line under ubuntu 20.04, using arm-none-eabi-gcc 9.2.1. Same results were observed using the pre-built .hex file (pca10056/s140).  nrfConnect is 3.7.0 and up-to-date.  online power profiler as of 24/08.

  • Hi

    No, these are not the default parameters for the BLE stack. Our SDK example projects use the DCDC (if available), and the external LF clock by default. Are you sure that your application is using the same parameters as what you've set in the Online Power Profiler? How big is the advertising payload for example in your application? In the Power Profiler app, how high voltage are you supplying the nRF with? Please also note that the Online Power Profiler are only estimates of the actual current consumption, even though they shouldn't differ as much as what you're observing of course.

    The peak currents are nothing to worry about, as there is (unfortunately) some noise from the PPK2, where it is prone to showing some very high peak currents that are a side effect of the automatic measurement resistor switching (to a higher ampere range).

    These current peaks are negligible in terms of measuring avg. current consumption, but the peak currents will be off. If you're aware of this, you can still use the PPK to measure peak currents, but you need to know what you're looking for. Below is a plot where I've zoomed in on a typical BLE advertising event. The peaks here are product of this bad filtering, and so the actual peak current (or TX current) will be the "peaks" that the arrow points to.

    Regarding your additional configurations: SW6 does not need to be set to "nRF Only" for current measurements as the nRF current measurement pins only measure current drawn from the nRF SoC on the DK anyways. SW10 is either ON or OFF, and when set ON, this lets the nRF be supplied by external voltage. When you're measuring using source mode, the DKs power supply should be the PPK 2 connected to P24 and P28.

    Best regards,

    Simon

  • Hi Simon,

    Thanks for the reply.

    I'm using the ble_app_pwr_profiling example from nrf5 SDK (16.0.0) without any modification. So it should be using the default BLE configuration and payloads from the example.  (I get similar behavior with the pre-compiled .hex file and a command line build (ubuntu 20.04, gcc 9.2.1), so I don't think it's a build issue.)

    I'm trying to provide the online profiler with compatible parameters to the existing example: I think the example uses 20ms ADV interval, 20ms connection interval and 20B notification payload, so that's what I used for the online profiler.  Please say if it should be something different.

    I use dc-dc=off  in the online profiler because the ppk2 trace seems to not show dc-dc (that would look like pulse width modulation, right?).  Using dc-dc=on in the online profiler gives even lower estimated current and so that would suggest even bigger discrepancies, if it really is using dc-dc.

    On your suggestion,  I tried both the internal and external crystal settings in the online profiler; it makes only a small difference in the estimated current, so I don't think this is a significant part of the discrepancy.

    The ppk2 is configured to provide 3V, same as the online profiler setting.  I measure ppk2 output at 2.98V using a meter.

    Thanks for the explanation about the extraneous peaks: I agree that this would explain some, but not all of the discrepancy.  I will double check this the next time I'm in the lab.

    Thanks!

  • Hi again

    Okay, first off, the scan request/response is not added in OPP, and will only be included now and then when the scanner asks for it. If you look at another advertising event for instance, you'll see advertising events more similar to the OPP graph.

    Please note that the average current will increase somewhat if you have a scanner that is constantly scanning and asks for scan requests very often.

    As fir tge 591uA over 20ms intervals you see in the OPP, that is without a payload, while in reality an advertisement will always have a payload. If you set the payload to ~20 bytes I think you should get closer to the default power profiling application.

    Also, in the last graph you uploaded, the last spike is not part of the radio event. Try marking the radio event (the two first bulks of current consumptions) and see if the "charge" looks correct compared to charge in the OPP. If it does, the part of the application using BLE/the radio will give the same average as in the OPP.

    Best regards,

    Simon

Related