This post is older than 2 years and might not be relevant anymore
More Info: Consider searching for newer posts

Debugging from VSCode with Cortex DEBUG and NRF Connect for VSCode

Hi, Im trying to get the debugger working in VSCode using the new nrfConnect for VSCode, while following the Youtube series for nRF Connect in VSCode. Im using the following versions:

nRF52840DK
nRF-Connect-2021.8.579.vsix
nRF-Terminal-2021.8.13.vsix
kconfig-lang-2021.8.3.vsix
devicetree-2021.8.2.vsix

In addition, Ive downloaded nRF Connect V3.7 and nRF Connect SDK V1.6.1.

I added the following lines to path, which got me a little further:


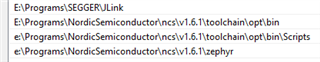
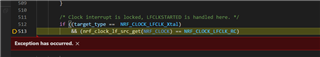
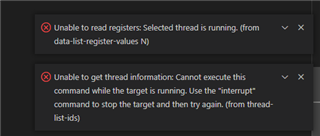
Now I get the following errors in the VSCode Debug Console:

Please check OUTPUT tab (Adapter Output) for output from JLinkGDBServerCL.exe
Launching server: "JLinkGDBServerCL.exe" "-singlerun" "-if" "swd" "-port" "50000" "-swoport" "50001" "-telnetport" "50002" "-device" "nRF52840_xxAA" "-select" "usb=683067661"
Launching GDB: "e:\Programs\NordicSemiconductor\ncs\v1.6.1\toolchain\opt\bin\arm-none-eabi-gdb.exe" "-q" "--interpreter=mi2"
undefinede:\Programs\NordicSemiconductor\ncs\v1.6.1\toolchain\opt\bin\arm-none-eabi-gdb.exe: warning: Couldn't determine a path for the index cache directory.
Reading symbols from e:\Revolve\Software\nRF_Example\BlinkLed_To_BareMetal\build\zephyr\zephyr.hex...
(No debugging symbols found in e:\Revolve\Software\nRF_Example\BlinkLed_To_BareMetal\build\zephyr\zephyr.hex)
0x00000452 in ?? ()
Program stopped, probably due to a reset and/or halt issued by debugger
add symbol table from file "e:/Revolve/Software/nRF_Example/BlinkLed_To_BareMetal/build/zephyr/zephyr.elf"
(y or n) [answered Y; input not from terminal]
Reading symbols from e:/Revolve/Software/nRF_Example/BlinkLed_To_BareMetal/build/zephyr/zephyr.elf...
2
Resetting target


The last line in the output is "Starting target CPU..."

My CMakeLists.txt looks like this, most of this is just adding stuff to see if it works:
# SPDX-License-Identifier: Apache-2.0

cmake_minimum_required(VERSION 3.13.1)
find_package(Zephyr REQUIRED HINTS $ENV{ZEPHYR_BASE})
project(gpio_testing)

add_definitions(-g -v -v -DDEBUG)

add_compile_options(
  "-Wall" "-Wpedantic" "-Wextra" "-fexceptions"
  "$<$<CONFIG:DEBUG>:-O0;-g3;-ggdb>"
)

set(CMAKE_BUILD_TYPE Debug)

target_sources(app PRIVATE src/main.c
                           src/gpio/gpio.c)


What are the points Im missing to get debugger to work in VSCode?

Parents
  • It does not stop at the breakpoint at the top of main.c. Ive seen sometimes that I can pause it in cpuidle.s, but Ive never gotten to main.c

  • Hi,

    Where are you setting the breakpoints? Have you tried setting multiple breakpoints inside the main() function in main.c? Does the application still run, even if you are not able to debug?

    What launch configuration are you using? In the debug window, the launch configuration will be what you can select in the drop down menu next to "RUN AND DEBUG" at the top of the sidebar. You can open the launch file by clicking on the gear symbol next to the drop down menu.

    Best regards,

    Marte

  • Ive set the following breakpoints:

    And none of them are triggering. The application is not running.

    I got some further by restarting and pausing a few times, and eventually I got to this point in clock_control_nrf.c


    The launch config seems to be this:

    {
        // Use IntelliSense to learn about possible attributes.
        // Hover to view descriptions of existing attributes.
        // For more information, visit: https://go.microsoft.com/fwlink/?linkid=830387
        "version": "0.2.0",
        "configurations": [
            {
                "name": "(gdb) Launch",
                "type": "cppdbg",
                "request": "launch",
                "program": "enter program name, for example ${workspaceFolder}/a.exe",
                "args": [],
                "stopAtEntry": false,
                "cwd": "${fileDirname}",
                "environment": [],
                "externalConsole": false,
                "MIMode": "gdb",
                "miDebuggerPath": "/path/to/gdb",
                "setupCommands": [
                    {
                        "description": "Enable pretty-printing for gdb",
                        "text": "-enable-pretty-printing",
                        "ignoreFailures": true
                    }
                ]
            }
        ]
    }


    Im guessing this fails cause I have not specified the path to the gdb and a program name?

    Do you know where I would find a gdb.exe (If its installed with the Segger JLink or nRF Connect SDK)? and what I should enter a program name?

  • Hi,

    The toolchain used with nRF Connect SDK is the GNU Arm Embedded Toolchain, so the gdb file would be arm-none-eabi-gdb.exe located in <gnuarmemb_installation_folder>/bin.

    However, from the launch file it seems like you are using the internal VS code debugger. When using the nRF Connect extension, you must debug from the extension itself. If you created the application in VS code, there should be a .vscode folder inside your application folder, BlinkLed_To_BareMetal, with a launch.json file. If you have that, can you try using that instead of gdb launch? If you do not have this folder or file, you can also create a new launch file and select that instead. It should contain the following:

    {
        // Use IntelliSense to learn about possible attributes.
        // Hover to view descriptions of existing attributes.
        // For more information, visit: https://go.microsoft.com/fwlink/?linkid=830387
        "version": "0.2.0",
        "configurations": [
            {
                "type": "nrf-connect",
                "request": "launch",
                "name": "Launch active build configuration",
                "config": "${activeConfig}",
                "runToEntryPoint": "main",
                "preLaunchTask": "nRF Connect: Build active configuration"
            },
            {
                "name": "Launch build",
                "type": "nrf-connect",
                "request": "launch",
                "runToEntryPoint": "main"
            }
        ]
    }

    Best regards,

    Marte

  • So I copied the config you posted into BlinkLed_To_BareMetal/.vscode/launch.json, and start the debugger from the nRF Connect VSCode extension. The output terminal stops after the following lines:

    Reading 64 bytes @ address 0x00000000
    Read 4 bytes @ address 0x00000038 (Data = 0x0000185D)
    Read 4 bytes @ address 0x0000015C (Data = 0x0E03EA41)
    Read 2 bytes @ address 0x00000430 (Data = 0xB508)
    Read 2 bytes @ address 0x00000038 (Data = 0x185D)
    Setting breakpoint @ address 0x00000038, Size = 2, BPHandle = 0x0001
    Setting breakpoint @ address 0x00000430, Size = 2, BPHandle = 0x0002
    Setting breakpoint @ address 0x00000432, Size = 2, BPHandle = 0x0003
    Starting target CPU...


    I also get the following errors


    Are there any places where I have to select the launch file? Or is that "fixed" by pressing debug from the nRF Connect VSCode extension?

Reply
  • So I copied the config you posted into BlinkLed_To_BareMetal/.vscode/launch.json, and start the debugger from the nRF Connect VSCode extension. The output terminal stops after the following lines:

    Reading 64 bytes @ address 0x00000000
    Read 4 bytes @ address 0x00000038 (Data = 0x0000185D)
    Read 4 bytes @ address 0x0000015C (Data = 0x0E03EA41)
    Read 2 bytes @ address 0x00000430 (Data = 0xB508)
    Read 2 bytes @ address 0x00000038 (Data = 0x185D)
    Setting breakpoint @ address 0x00000038, Size = 2, BPHandle = 0x0001
    Setting breakpoint @ address 0x00000430, Size = 2, BPHandle = 0x0002
    Setting breakpoint @ address 0x00000432, Size = 2, BPHandle = 0x0003
    Starting target CPU...


    I also get the following errors


    Are there any places where I have to select the launch file? Or is that "fixed" by pressing debug from the nRF Connect VSCode extension?

Children
Related