This post is older than 2 years and might not be relevant anymore
More Info: Consider searching for newer posts
This discussion has been locked.
You can no longer post new replies to this discussion. If you have a question you can start a new discussion

MQTTSN Example: Client unable to reconnect to Broker after timeout

Hello,

I am currently using mqttsn publisher exams with keep allive time of 30 seconds, so according to MQTT standard if period of inactivity will be 45 second and the client is unable to recieve ping response or broker doesn't recieve ping request from client in fixed time it will break the connection.

I would like to know how could I reconnect client to the broker once the broker timesout the client connection. Currently I am checking the state of client using isConnected api but it indeed take 3-4 minutes to restablish a connection. 

I would like to re-establish a connection as soon as the mqtt-sn client get's time out. I can't wait for 2-3 minutes to connect to broker. Also currently I have to wait for the next publish to check whether my client is connected to broker or not.

For Example: if I take a python MQTT client with keep alive time of 60 second and turn off and turn on the mosquito broker , the python client immediately connects within few seconds. I want some solution like that for mqtt-sn client. 

Please provide some tried and tested code or help for the same.  

  • Hey Sigurd,

    Thanks for assistance. I managed to achieve a state machine for mqtt-sn examples.

    Currently my devices are in testing stage, once i feel everything is working properly I would close this ticket.

    Till that can you please tell me what's exactly is the use of polling period in sleepy example. Because when I try to measure the current consumption it give me spikes in uA every few seconds. I would like to keep my device in sleep state for 5 minutes. Than what should be my default and short poll period ?

  • Hi

    Good to hear that the state machine works!

    The nRF5 SDK samples are not power optimized by default. I will have a look at the Sleepy Publisher sample to try to power optimize it.

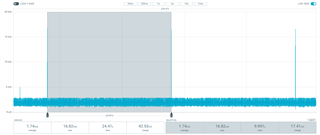
    Without the power optimization, the power usage looks like this:

    This is with DEFAULT_POLL_PERIOD as 10000, that is 10 seconds.
    The Default Poll Period is how often the Thread Sleepy End Device will ping the Thread Network to show that it is alive, as well as get updates from the Thread Network.

    From the plot above, this is when the Current spikes appear.

    Could you post your current measurement plot, so that I can easier understand your issue?

    Regards,
    Sigurd Hellesvik

  • Hello Sigurd, 

    Thanks for the explanation regarding polling period. Have you tried optimising the power consumption yet ? Because my device will be transmitting data reading i2c based sensors, so I would like to sleep my device and optimise the power consumption as much as possible. 

    Also I don't have power profiler so I can't provide you such a graph.  

  • Brian (Geek) said:

    Thanks for the explanation regarding polling period. Have you tried optimising the power consumption yet ? Because my device will be transmitting data reading i2c based sensors, so I would like to sleep my device and optimise the power consumption as much as possible. 

    Also I don't have power profiler so I can't provide you such a graph. 

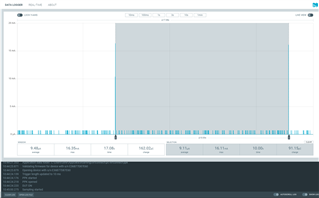
    My error in the previous graph was that I were running with debugging enabled. Without debugging, the graph from the mqttsn publisher sample (with logging disabled)looks like this:

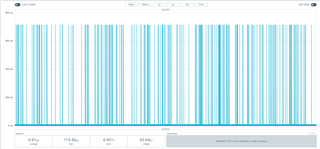
    The low part of the power consumption use an average of 7uA:

    When you say:

    Brian (Geek) said:
    Because when I try to measure the current consumption it give me spikes in uA every few seconds

    How do you measure this current consumption?
    How big are the spikes?
    How many seconds?

    Regards,
    Sigurd Hellesvik

  • Hello Sigurd,

    Sorry for late response.

    I am doing current measurement using multimeter. I am getting 6uA but after couple of seconds I can see spike of around 600-700 uA even when I am not doing anything. Also I see in your graph from profiler kit there are many spike of around 600-700 uA . What is that from. When I try to publish 1K bytes of data I get current consumption spike of around 4-6mA while sending data. Can you tell me from where are this spikes of 600uA coming from ? If I set a poll period of 4s, than I should a spike after 4 seconds right ? 

    Can you please explain ? 

Related