
want to know how can i judge that the variation is caused in the connection interval, connection supervision timeout, slave latency once i have flashed ble_app_template code in nrf52832 s132.
want to know how can i judge that the variation is caused in the connection interval, connection supervision timeout, slave latency once i have flashed ble_app_template code in nrf52832 s132.

Could you also elaborate how you verified that the connection interval was actually 1000 and 4000 ms?
ans: as suggested by you i had set :
#define MIN_CONN_INTERVAL MSEC_TO_UNITS(1000, UNIT_1_25_MS)
#define MAX_CONN_INTERVAL MSEC_TO_UNITS(1000, UNIT_1_25_MS)
and next time as:
#define MIN_CONN_INTERVAL MSEC_TO_UNITS(4000, UNIT_1_25_MS) /**< Minimum acceptable connection interval (0.5 seconds). */
#define MAX_CONN_INTERVAL MSEC_TO_UNITS(4000, UNIT_1_25_MS) /**< Maximum acceptable connection interval (1 second). */
#define SLAVE_LATENCY 1 /**< Slave latency. */
#define CONN_SUP_TIMEOUT MSEC_TO_UNITS(16010, UNIT_10_MS) /**< Connection supervisory time-out (4 seconds). */
then i got only 16 logs which rendered sleep afterwards.
However with Connection Interval as:
#define MIN_CONN_INTERVAL MSEC_TO_UNITS(7.5, UNIT_1_25_MS)
#define MAX_CONN_INTERVAL MSEC_TO_UNITS(100, UNIT_1_25_MS)
device did not fall to sleep and gave logs continuously

Ridhi said:ans: as suggested by you i had set :
#define MIN_CONN_INTERVAL MSEC_TO_UNITS(1000, UNIT_1_25_MS)
#define MAX_CONN_INTERVAL MSEC_TO_UNITS(1000, UNIT_1_25_MS)and next time as:
Setting the peripheral's preference is not equal to verifying what connection interval that is actually being used. As mentioned the peripheral may only request an update of the parameters. It does not have any decision making powers over the central.
To verify which connection parameters are used you will either have to have the logger of the peripheral or central output the used connection parameters and updates or use the nRF Sniffer tool to see which interval is actually being used.
Ridhi said:and next time as:
#define MIN_CONN_INTERVAL MSEC_TO_UNITS(4000, UNIT_1_25_MS) /**< Minimum acceptable connection interval (0.5 seconds). */
#define MAX_CONN_INTERVAL MSEC_TO_UNITS(4000, UNIT_1_25_MS) /**< Maximum acceptable connection interval (1 second). */
#define SLAVE_LATENCY 1 /**< Slave latency. */
#define CONN_SUP_TIMEOUT MSEC_TO_UNITS(16010, UNIT_10_MS) /**< Connection supervisory time-out (4 seconds). */then i got only 16 logs which rendered sleep afterwards.
Is there anything else unexpected that happens?
Does the device reset? Does anything unexpected appear in the logs you are seeing? Does the central device log anything unexpected?
Saying that you suddenly only see 16 logs does not provide me with any information to debug with.
I am not sure we will be getting anywhere with this until we see a sniffer trace. Could you capture a sniffer trace of these two scenarios, and upload the traces along with the peripheral's logs?
It is hard for me to suggest anything at all from your current description of the issue.
Best regards,
Karl

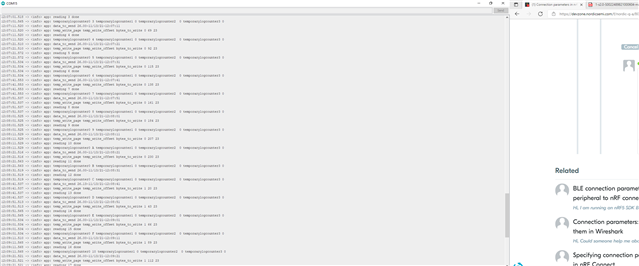
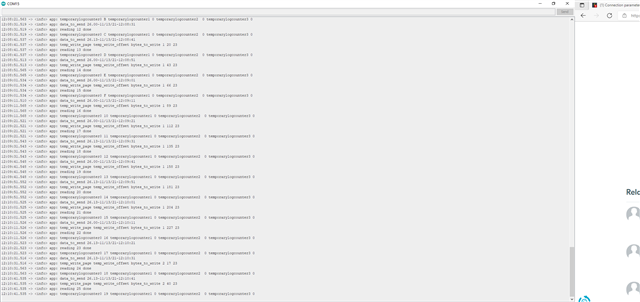
with above configuration i get many log values and logging continues:
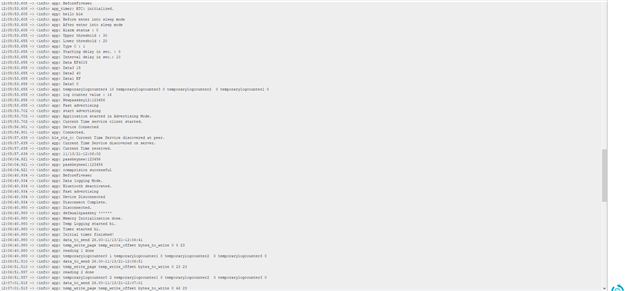
but with 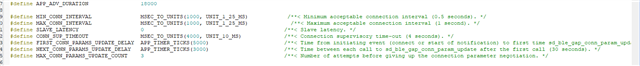
after 16 logs nothing happens and logs stop without any error but in power profiler i saw that logging stopped after 16 values
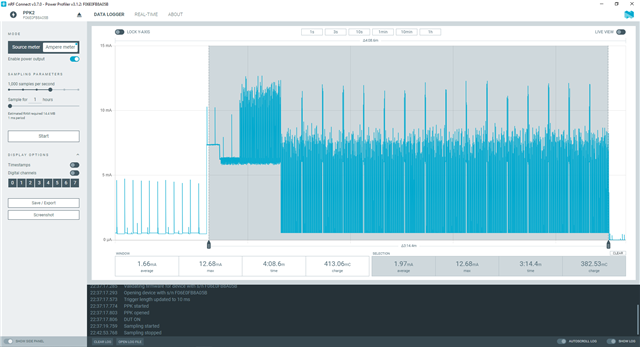
no value after 16 logs
Karl pls look into at earliest
Please share logs using the Insert -> Code -> Text option rather than sharing screenshots of the logs. Proper formatting drastically increases readability and thus makes debugging easier.
Please also show me the log for the scenario in which the application seemingly stops after 16 logs.
Have you run a debugging session and checked out if the program counter gets stuck anywhere following the 16'th logging?
Please see my previous comment about the sniffer.
Could you capture a sniffer trace of these two scenarios in addition to the logs?
Best regards,
Karl