I've been developing in the following environment:
Windows 10
NRF Connect for Desktop
with few problems for the past six months.
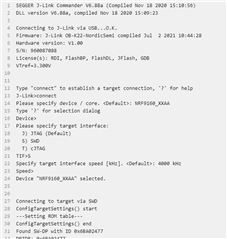
On Friday 12/10 I was suddenly unable to debug my application - Toolchain V 1.7.0 /Seggar - would not download new code to my board.
After a little investigation I discovered that Programmer (accessed via NRF Connect for Desktop) did not recognize my custom board, nor would it recognize any of three NRF Development Kits. I have two PCA10095 and a very old PCA10001.
I uninstalled NRF Connect, NRF Command Line Tools and Segger JLink and re-installed and see the same results.
The log file from Programmer is
2021-12-13T11:53:25.533Z INFO Application data folder: C:\Users\kover\AppData\Roaming\nrfconnect\pc-nrfconnect-programmer
2021-12-13T11:53:26.903Z DEBUG iface: Ethernet
2021-12-13T11:53:26.904Z DEBUG IP4:
2021-12-13T11:53:26.905Z DEBUG IP6:
2021-12-13T11:53:26.905Z DEBUG MAC: fc:45:96:40:9d:f8
2021-12-13T11:53:26.908Z DEBUG Client Id: 7bceaabb4095f603df72b9f31da50b0996a1c324
2021-12-13T11:53:26.910Z DEBUG Google Analytics for category pc-nrfconnect-programmer has initialized
2021-12-13T11:53:27.149Z DEBUG App pc-nrfconnect-programmer v2.0.1 official
2021-12-13T11:53:27.150Z DEBUG App path: C:\Users\kover\.nrfconnect-apps\node_modules\pc-nrfconnect-programmer
2021-12-13T11:53:27.150Z DEBUG nRFConnect 3.9.1, required by the app is (^3.8.0)
2021-12-13T11:53:27.150Z DEBUG nRFConnect path: C:\Users\kover\AppData\Local\Programs\nrfconnect\resources\app.asar
2021-12-13T11:53:27.150Z DEBUG HomeDir: C:\Users\kover
2021-12-13T11:53:27.150Z DEBUG TmpDir: C:\Users\kover\AppData\Local\Temp
2021-12-13T11:53:28.310Z ERROR Error while probing devices, more details in the debug log: JLINKARM_DLL_ERROR (Origin: "Error when running nrfdl_enumerate")
The System Report from Programmer is
# nRFConnect System Report - 2021-12-13T11-56-12.270Z
- System: LENOVO 80UD
- BIOS: InsydeH2O 05.05.261TCN27WW(V2.08)
- CPU: 1 x Intel Core
Core i3-6100U 2.3 GHz 4 cores (2 physical)
- Memory: 4 GB free of 7.9 GB total
- Filesystem: C: (NTFS) 231.8 GB 71.4% used
- OS: Microsoft Windows 10 Home (10.0.19042) win32 ia32
- Versions
- kernel: 10.0.19042
- git: 2.33.0.windows.2
- node: 14.16.0
- python: 3.9.9
- python3: 3.9.9
- Connected devices:
I have tried this on two different laptops and see precisely the same results.
The System report from the Second system is
# nRFConnect System Report - 2021-12-13T11-59-28.174Z

- System:     HP HP Laptop 14-dk1xxx
- BIOS:       AMI HPQOEM - 1072009
- CPU:        1 x AMD Athlon Silver 3050U with Radeon Graphics 2.3 GHz 2 cores (2 physical)
- Memory:     785 MB free of 3.4 GB total
- Filesystem: C: (NTFS) 56.8 GB 77.1% used

- OS:         Microsoft Windows 10 Home (10.0.19042) win32 ia32

- Versions
    - kernel: 10.0.19042
    - git: 2.33.0.windows.2
    - node: 14.16.0
    - python:
    - python3:

- Connected devices: