Module NRF52832
Sdk: 15.2
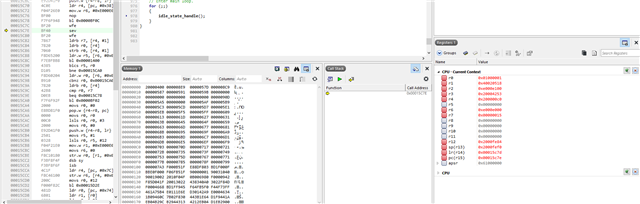
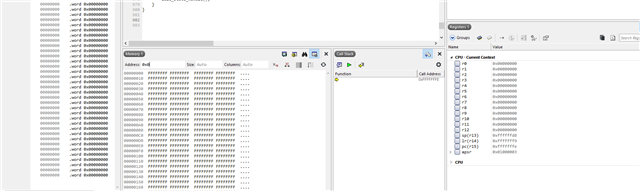
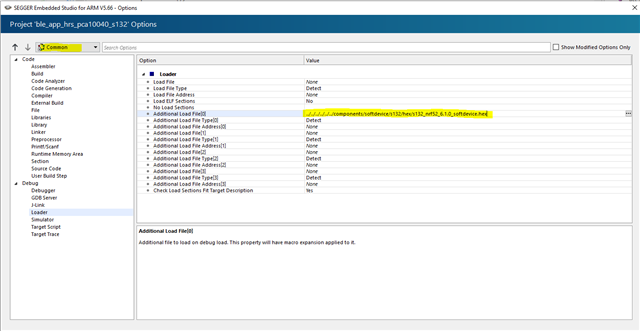
I am trying to debug the module on a custom board, debugging worked fine until something weird happened on the specific board...
After the programming is done, the sp and the pc look wrong.
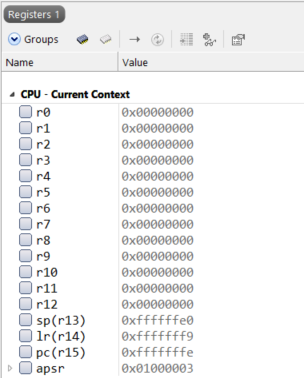
I have tried to use the command to recover, but it does not work:
./nrfjprog.exe --recover
Recovering device. This operation might take 30s.
Erasing user code and UICR flash areas.
When I tried to debug the same code with another device, the debug session works as expected:
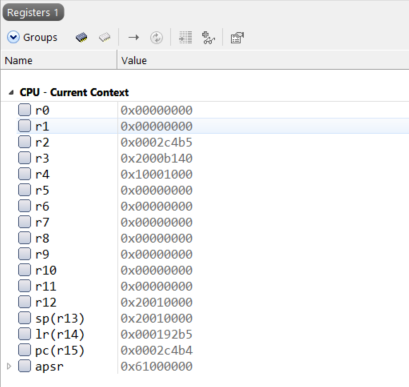
I think the device with the issue is in a state where I don't understand.
How can I recover the device?
What are the steps that I can perform to get more information out of the device with issue?
Many thanks,
Edward