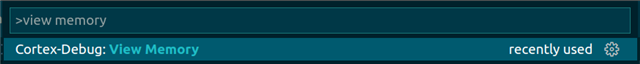
I want to open memory window to check the flash area data which has been written when I was debugging with Visual Studio Code but I can NOT find and open the memory window.
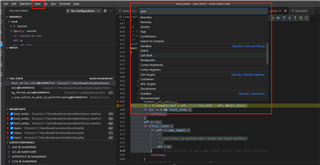
how can I open this memory window in debugging?
I want to open memory window to check the flash area data which has been written when I was debugging with Visual Studio Code but I can NOT find and open the memory window.
how can I open this memory window in debugging?