PoWer Profiler Kit 2

Hello All,

We are using Power Profilier Kit 2 for measuring the current consumption of our device.

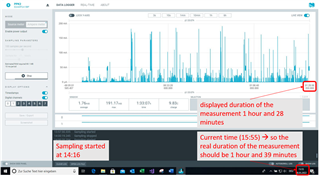
We Start the measurement at 14:16 PM. after 1 hour and 39 minutes (at 15:55 PM) the power profiler measurement duration shows only 1 hour and 28 minutes.

In this case the Power Profiler tool shows only 88,9% of the real time.

After a longer measurement (around 25 hours), the measurement tool shows an duration of only 18 hours. So in this case the tool shows only 72% oft he real time.

The longer the measurement takes, the bigger the percentage offset.

How we can reduce this percentage offset for longer range of testing. are there some additional settings which we are missing out.

Also we have attached a image for refrence 


We use 4 Power Profiler kit II with nrf Connect for Desktop v.3.9.3 and official Power Profiler App version 3.4.2 and observed the issue at all devices.

While using the current nrf Connect for Desktop version (3.10.0) we are not able to open the Power Profiler App (no Apps are displayed in the tool after the update)

Thanks and Regards

Utkarash

Parents
  • Here is feedback from the team. "The time on the axis is based on the fact that every sample from PPK takes 10usec. If the PPK hw for some reason is not accurate in that regard, or there is some data loss that is not reported otherwise, it could lead to this difference."

    How does this phenomenon affect your work?
  • Thank for the feedback,

    How does this phenomenon affect your work?

    When we are measuring the current  for a long period of time (for example 1 week) as discussed earlier the difference is big.

    In this measurement there are instances where we have a peak current consumption from the device side,

    So we want to recongnise that when where these instancess and how long they lasted so that we can determin during which phase of its functionality does the device consumes more current,

    The time on the axis is based on the fact that every sample from PPK takes 10usec

    Okay thank you for the information, So does this mean that we have to carry out some calculations with respect to this sampling period and figure the peak consumption details

    Also as i understand when we are calculating the total current consumption should we consider the actual time between the start and stop time of the calcul;ation instaed of the duration show on the PPK.

Reply
  • Thank for the feedback,

    How does this phenomenon affect your work?

    When we are measuring the current  for a long period of time (for example 1 week) as discussed earlier the difference is big.

    In this measurement there are instances where we have a peak current consumption from the device side,

    So we want to recongnise that when where these instancess and how long they lasted so that we can determin during which phase of its functionality does the device consumes more current,

    The time on the axis is based on the fact that every sample from PPK takes 10usec

    Okay thank you for the information, So does this mean that we have to carry out some calculations with respect to this sampling period and figure the peak consumption details

    Also as i understand when we are calculating the total current consumption should we consider the actual time between the start and stop time of the calcul;ation instaed of the duration show on the PPK.

Children
No Data
Related