This discussion has been locked.
You can no longer post new replies to this discussion. If you have a question you can start a new discussion

To identify, adjust sleep period of sample app threads?

Hello Devzone Community,

My name is Ted, and I am continuing my effort to configure a Zephyr based, Nordic aws_iot sample app based firmware to run and support nRF9160 lowest specified power consumption. I am in the process of putting all application threads to sleep, so that Zephyr's idle thread can put the application processor into a low power sleep mode. Nordic Power Profiler waveforms of measured current draw, however, indicate that I've failed in this. Some part of the overall firmware binary appears to be yet running. Lowest average current I achieve is ~190 microamps.

My Devzone account doesn't permit me to upload photos, but here is a link to two captures from Nordic's power profile which I took earlier today.  My apology that I must include an external link here and not the images directly:

wiki.neelanurseries.com/.../20220311

The first one shows a general pattern of current regularly spiking from a few microamps to around three milliamps.  The zoomed capture shows the ten millisecond spikes, a more distinct fast spike and a more blunted longer duration one.

These are taken during a 45 second period when all my application threads are sleeping -- for 45 seconds -- and LTE modem is turned off, and GPIOs to hardware enable points of our board are also turned off, effectively powering down the hardware outside the nRF9160.

From these waveforms I observe that some ARM processor activity appears to be consuming current every ten milliseconds. But though I have put my app threads into a nearly minute long sleep period, and have searched for the sleep periods set on aws_iot sample app threads, I cannot see any firmware configured device or service that is configured to run every ten milliseconds.

This work is based on Nordic's aws_iot sample app, as it appears in ncs v1.6.1. The sample app creates three or four Zephyr threads. Zephyr itself creates a  thread for `int main()` and an idle thread. Work of my own adds a few more threads at run time. These latest threads I can readily put to sleep for minutes or even hours, with a call to k_sleep() in a given thread's effective main function.

I have enabled Zephyr's thread_analyzer feature, and can observe simple reporting at run time of the threads of this firmware. Here is a typical Zephyr output I can see via a serial connection, and using a simple CLI to invoke a handful of commands:

Excerpt 1: Zephyr thread summary report

```1) 'thread_accelerometer' stack size 2048 bytes, stack used 960 bytes, 46%
2) 'thread_dev_work' stack size 3072 bytes, stack used 1504 bytes, 48%
3) 'thread_simple_cli' stack size 4096 bytes, stack used 1768 bytes, 43%
4) 'thread_led' stack size 512 bytes, stack used 136 bytes, 26%
5) 'download_client' stack size 4096 bytes, stack used 104 bytes, 2%
6) 'at_cmd_socket_thread' stack size 1472 bytes, stack used 688 bytes, 46%
7) 'time_thread' stack size 1024 bytes, stack used 728 bytes, 71%
8) 'connection_poll_thread' stack size 3072 bytes, stack used 296 bytes, 9%
9) '0x20015ab0' stack size 1024 bytes, stack used 168 bytes, 16%
10) 'sysworkq' stack size 2048 bytes, stack used 168 bytes, 8%
11) 'idle 00' stack size 320 bytes, stack used 56 bytes, 17%```


Here I modify the report to annotate each thread's origin, which affects how easily or not I can adjust a thread's sleep time:

Excerpt 2:

```1) 'thread_accelerometer' . . . home authored application
2) 'thread_dev_work' . . . home authored application
3) 'thread_simple_cli' . . . home authored application
4) 'thread_led' . . . home authored application
5) 'download_client' . . . aws_iot sample app
6) 'at_cmd_socket_thread' . . . aws_iot sample app
7) 'time_thread' . . . aws_iot sample app
8) 'connection_poll_thread' . . . aws_iot sample app
9) '0x20015ab0' . . . ?, not known
10) 'sysworkq' . . . Zephyr 2.6.0
11) 'idle 00' . . . Zephyr 2.6.0```


So far I have been able to track down in Zephyr's dwt.h library header file that the time thread has a default sleep period of 3600 seconds. Tracing thread 'at_cmd_socket_thread' which is implemented in ncs/nrf/subsys/net/lib/aws_iot/src/aws_iot.c I cannot tell what this thread's effective sleep period is.

Question (1): Can a Devzone team member or community member help me identify where this thread's sleep time is realized?

I have yet to find the implementation details for thread 'download_client', 'connection_poll_thread' and '0x20015ab0'. The last of these threads I have concern for. It is not named, and so I cannot be sure whether it is a Zephyr construct or a Nordic sample app construct. This unnamed thread has shown in the thread analyzer report since I enabled Zephyr's analyzer.


Question (2): is static code analysis the only way to learn "who" in the Zephyr and other source codes is creating the unnamed thread?

Until I can identify the unnamed thread, I won't know whether I can cleanly properly adjust its sleep period. If it is a kernel thread, my app space firmware won't automatically have privileges to make any changes to a kernel thread. I believe there are some extra steps to be able to do so, if that is even possible.

I recognize also that I cannot simply change sleep times of the aws_iot sample app threads, and expect celular level and MQTT client-broker connections to continue to function. I'll need to study and find a way to cleanly close connections before putting such threads to sleep.

Thanks ahead of time to all who can shed some light and help on these deep sleep and nRF9160 power saving questions!

- Ted

Parents
  • Hi,

    . Tracing thread 'at_cmd_socket_thread' which is implemented in ncs/nrf/subsys/net/lib/aws_iot/src/aws_iot.c I cannot tell what this thread's effective sleep period is.

    I am not sure which thread you are talking about here, the at_cmd_socket_thread defined in the at_cmd library or the connection_poll_thread defined in the aws_iot library?

    The connection_poll_thread's sleep period has a upper bound of CONFIG_MQTT_KEEPALIVE, but it will wake up earlier if something is received on the socket, or if it was delayed in going into sleep and therefore need to wake up sooner to keep the connection alive. The maximum MQTT keepalive timeout supported by AWS is 1200 seconds.

    The at_cmd_socket_thread should sleep while waiting for activity on the AT socket. I.e. either a URC or the response to a command sent from the application.

    I have yet to find the implementation details for thread 'download_client'

    'download_client' is defined in nrf/subsys/net/lib/download_client/src/download_client.c. It is suspended while not actively downloading something (typically FOTA files).

    'connection_poll_thread'

    See above.

    '0x20015ab0'. The last of these threads I have concern for. It is not named, and so I cannot be sure whether it is a Zephyr construct or a Nordic sample app construct. This unnamed thread has shown in the thread analyzer report since I enabled Zephyr's analyzer.


    Question (2): is static code analysis the only way to learn "who" in the Zephyr and other source codes is creating the unnamed thread?

    CONFIG_THREAD_NAME=y should give you the name of the thread, but given that you get the other thread names, I assume you already have it set?

    The thread might come from the modem_lib. I don't know of any easy ways of verifying that, but printing the thread id argument in nrf/lib/nrf_modem_lib/nrf_modem_os.c@thread_monitor_entry_get, and comparing it to the ID or your un-named thread might work.

    Best regards,

    Didrik

  • 2022-03-14 Mondy

    Hello Didrik,

    To your questions, yes I have CONFIG_THREAD_NAMES=y set in prj.conf. I've also amended the source file nrf_modem_os.c to see the following messages. I can see that periodically, every ten or fifteen seconds, routine thread_monitor_entry_get() is called. In the first ten seconds after firmware start up I see thread 'main' getting processed there. After twenty seconds or so modem firmware module seems to reach a steady state behavior. At this point onwards it processes only two threads, thread 'at_cmd_socket_thread' and one of my own.

    Excerpt 1 - output from amended nrf_modem_os.c:

    - DEV 0314 - thread_monitor_entry_get() called with k_tid_t = 0x200150D0, 'thread_dev_work'
    - DEV 0314 - thread_monitor_entry_get() called with k_tid_t = 0x200150D0, 'thread_dev_work'
    - DEV 0314 - thread_monitor_entry_get() called with k_tid_t = 0x200150D0, 'thread_dev_work'
    - DEV 0314 - thread_monitor_entry_get() called with k_tid_t = 0x200159A0, 'at_cmd_socket_thread'
    - DEV 0314 - thread_monitor_entry_get() called with k_tid_t = 0x200159A0, 'at_cmd_socket_thread'
    - DEV 0314 - thread_monitor_entry_get() called with k_tid_t = 0x200159A0, 'at_cmd_socket_thread'

    * main.c * calling app config module to configure other modules . . .

    - DEV 0314 - thread_monitor_entry_get() called with k_tid_t = 0x20017820, 'main'
    - DEV 0314 - thread_monitor_entry_get() called with k_tid_t = 0x20017820, 'main'
    - DEV 0314 - thread_monitor_entry_get() called with k_tid_t = 0x20017820, 'main'
    - DEV 0314 - thread_monitor_entry_get() called with k_tid_t = 0x200159A0, 'at_cmd_socket_thread'
    - DEV 0314 - thread_monitor_entry_get() called with k_tid_t = 0x200159A0, 'at_cmd_socket_thread'
    - DEV 0314 - thread_monitor_entry_get() called with k_tid_t = 0x200159A0, 'at_cmd_socket_thread'
    - DEV 0314 - thread_monitor_entry_get() called with k_tid_t = 0x200159A0, 'at_cmd_socket_thread'
    - DEV 0314 - thread_monitor_entry_get() called with k_tid_t = 0x200159A0, 'at_cmd_socket_thread'
    .
    .
    .

    - DEV 0314 - thread_monitor_entry_get() called with k_tid_t = 0x200150D0, 'thread_dev_work'
    - DEV 0314 - thread_monitor_entry_get() called with k_tid_t = 0x200150D0, 'thread_dev_work'
    - DEV 0314 - thread_monitor_entry_get() called with k_tid_t = 0x200150D0, 'thread_dev_work'
    - DEV 0314 - thread_monitor_entry_get() called with k_tid_t = 0x200159A0, 'at_cmd_socket_thread'
    - DEV 0314 - thread_monitor_entry_get() called with k_tid_t = 0x200159A0, 'at_cmd_socket_thread'
    - DEV 0314 - thread_monitor_entry_get() called with k_tid_t = 0x200159A0, 'at_cmd_socket_thread'
    - DEV 0314 - thread_monitor_entry_get() called with k_tid_t = 0x200150D0, 'thread_dev_work'
    - DEV 0314 - thread_monitor_entry_get() called with k_tid_t = 0x200150D0, 'thread_dev_work'
    - DEV 0314 - thread_monitor_entry_get() called with k_tid_t = 0x200150D0, 'thread_dev_work'
    - DEV 0314 - thread_monitor_entry_get() called with k_tid_t = 0x200159A0, 'at_cmd_socket_thread'
    - DEV 0314 - thread_monitor_entry_get() called with k_tid_t = 0x200159A0, 'at_cmd_socket_thread'
    - DEV 0314 - thread_monitor_entry_get() called with k_tid_t = 0x200159A0, 'at_cmd_socket_thread'
    - DEV 0314 - thread_monitor_entry_get() called with k_tid_t = 0x200150D0, 'thread_dev_work'
    - DEV 0314 - thread_monitor_entry_get() called with k_tid_t = 0x200150D0, 'thread_dev_work'
    - DEV 0314 - thread_monitor_entry_get() called with k_tid_t = 0x200150D0, 'thread_dev_work'
    - DEV 0314 - thread_monitor_entry_get() called with k_tid_t = 0x200159A0, 'at_cmd_socket_thread'
    - DEV 0314 - thread_monitor_entry_get() called with k_tid_t = 0x200159A0, 'at_cmd_socket_thread'
    - DEV 0314 - thread_monitor_entry_get() called with k_tid_t = 0x200159A0, 'at_cmd_socket_thread'


    The phrasing "k_tid_t =" in reality should be "k_tid_t instance points to address". But what's clear is that the unnamed thread never seems to be passed by reference to this routine.

    Given the waveforms of current use, with spikes every ten milliseconds, I have assumed that there's something in the firmware not going to sleep. These current waveforms look as though they come from a digitally controlled source, given their periodic timing. That is, I would expect most overlooked hardware "power consumers" to add some DC offset to current used.

    All threads I have added to my project I have assigned names to them. I have always called `k_tid_t thread_x = k_thread_create(&thread_x_data, thread_x_stack_area, ...);. As I am turning off the nRF9160 LTE modem by sending `AT+CFUN=4`, then putting all my application threads into sleep period of 45 seconds, make I a reasonable guess that there is some other thread in third party sources?

    My next step is to comment out the calls to aws_iot sample app code. This will be a blanket approach at first, assuming I get beyond the initial commenting, to see whether I can draw less than ~190 microamps with all aws_iot code disabled, and just my own application put to sleep as I am able to sleep it now.

    Thank you for your help so far, Didrik. Searching further for the root cause here, will check back and update this post . . .

    - Ted

  • Hello Didrik,

    Your advice to investigate the Nordic library source routine `nrf/lib/nrf_modem_lib/nrf_modem_os.c@thread_monitor_entry_get()` has been helpful.  This also helped me locate a design problem in my own code, which I removed, and has brought down my project's average low power current draw to ~85 microamperes.

    It is still true however that I observe mostly periodic current spikes in spite of turning off hardware outside of the nRF9160, turning off LTE modem, putting all application threads to sleep for 45 seconds.  It remains the case that about every 25 milliseconds, occassionally 30 to 35 milliseconds, I observe current spike up to 4 millamps, while the average is about 85 microamps.

    Question (1)  the code you reference in nrf_modem_os.c runs as part of the LTE modem, and runs on a processor in the nRF9160 separate from the ARM Cortex-M33, yes?

    Question (2)  the AT command `AT+CFUN=4` powers down the LTE modem.  Does it also effectively halt and power down whatever processing unit that runs nrf_modem_os.c and associated sources?  Or is nrf_modem_os.c compiled into the final application binary that I get to flash onto the application processor, the Cortex-M33?

    I hope my questions do not stray too far from my original post. I will now cast the net again to see how to programmatically set PSM and eDRX for the LTE modem, as I suspect AT+CFUN=4 is not the correct way to fully power down the LTE modem.

    Thank you again for your help,

    - Ted

Reply
  • Hello Didrik,

    Your advice to investigate the Nordic library source routine `nrf/lib/nrf_modem_lib/nrf_modem_os.c@thread_monitor_entry_get()` has been helpful.  This also helped me locate a design problem in my own code, which I removed, and has brought down my project's average low power current draw to ~85 microamperes.

    It is still true however that I observe mostly periodic current spikes in spite of turning off hardware outside of the nRF9160, turning off LTE modem, putting all application threads to sleep for 45 seconds.  It remains the case that about every 25 milliseconds, occassionally 30 to 35 milliseconds, I observe current spike up to 4 millamps, while the average is about 85 microamps.

    Question (1)  the code you reference in nrf_modem_os.c runs as part of the LTE modem, and runs on a processor in the nRF9160 separate from the ARM Cortex-M33, yes?

    Question (2)  the AT command `AT+CFUN=4` powers down the LTE modem.  Does it also effectively halt and power down whatever processing unit that runs nrf_modem_os.c and associated sources?  Or is nrf_modem_os.c compiled into the final application binary that I get to flash onto the application processor, the Cortex-M33?

    I hope my questions do not stray too far from my original post. I will now cast the net again to see how to programmatically set PSM and eDRX for the LTE modem, as I suspect AT+CFUN=4 is not the correct way to fully power down the LTE modem.

    Thank you again for your help,

    - Ted

Children
  • tedhavelka said:
    Your advice to investigate the Nordic library source routine `nrf/lib/nrf_modem_lib/nrf_modem_os.c@thread_monitor_entry_get()` has been helpful.  This also helped me locate a design problem in my own code, which I removed, and has brought down my project's average low power current draw to ~85 microamperes.

    Great to hear that you at least got some use out of it!

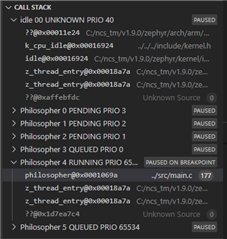
    Another possiblilty for finding the source of the unnamed thread is to use a debugger. If you have up-to-date version of the nRF Command line Tools (nrfjprog, etc., newest is 10.15.4), and use VS Code with the nRF Connect extension, thread aware debugging should work out-of-the-box. That should give you the callstack of each individual thread, which should let you identify the thread.

    E.g. in Zephyr's philosophers sample:

    tedhavelka said:
    Question (1)  the code you reference in nrf_modem_os.c runs as part of the LTE modem, and runs on a processor in the nRF9160 separate from the ARM Cortex-M33, yes?

    Only the code in the modem .zip runs on the modem core. The code in nrf_modem_os.c, and the pre-compiled modem_lib in nrfxlib runs on the application core.

    tedhavelka said:
    Question (2)  the AT command `AT+CFUN=4` powers down the LTE modem.  Does it also effectively halt and power down whatever processing unit that runs nrf_modem_os.c and associated sources?  Or is nrf_modem_os.c compiled into the final application binary that I get to flash onto the application processor, the Cortex-M33?

    AT+CFUN=4 sets the modem in offline mode, and the modem will be in idle mode, but able to wake up on AT commands.

    To turn the modem off completely, you must use nrf_modem_shutdown(). Note that the difference in current consumption isn't that big. And usually, it is better to leave the modem running, and using PSM instead of disconnecting from the network completely (but of course, this depends a lot on the use case, if PSM is available, etc.).

Related