Hi
I just started using VS with Nordic and keep getting the error below can someone please assist.
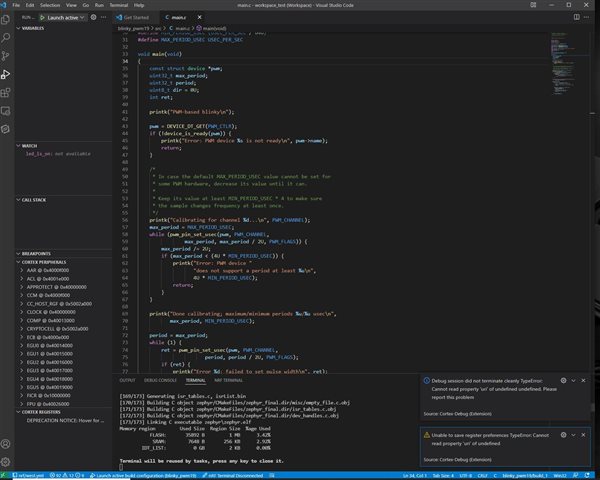
Debug session did not terminate cleanly TypeError: Cannot read property 'uri' of undefined undefined. Please report this problem.
Regards
David
HI
Yes I am using Visual studio with Nordic connect project Blinky , I can run the debugger but if I stop it to go back to the editor,
this is the line that comes up in the terminal. Then just stays in the debugger environment .
Debug session did not terminate cleanly TypeError: Cannot read property 'uri' of undefined undefined. Please report this
Regards
David
David, I tried running the Blinky sample and debug it using the nRF Connect debug feature, on a nRF52840 DK.
Here is the output from Debug Console
Launching GDB: "c:\\NordicSemi\\v1.9.1\\toolchain\\opt\\bin\\arm-none-eabi-gdb.exe" -q --interpreter=mi2 "c:\\Temp\\Support\\286021\\blinky\\build\\zephyr\\zephyr.hex"
Set "showDevDebugOutput": true in your "launch.json" to see verbose GDB transactions here. Helpful to debug issues or report problems
Reading symbols from c:\Temp\Support\286021\blinky\build\zephyr\zephyr.hex...
(No debugging symbols found in c:\Temp\Support\286021\blinky\build\zephyr\zephyr.hex)
WARNING: Cortex-Debug will deprecate use of GDB version 8. Please upgrade to version 9+
Launching gdb-server: "C:\\Program Files (x86)\\SEGGER\\JLink\\JLinkGDBServerCL.exe" -singlerun -nogui -if swd -port 50000 -swoport 50001 -telnetport 50002 -device nRF52840_xxAA -select usb=683376211 -rtos "C:\\Program Files (x86)\\SEGGER\\JLink\\GDBServer\\RTOSPlugin_Zephyr.dll"
Please check TERMINAL tab (gdb-server) for output from C:\Program Files (x86)\SEGGER\JLink\JLinkGDBServerCL.exe
0x000011f2 in ?? ()
Program stopped, probably due to a reset and/or halt issued by debugger
add symbol table from file "c:/Temp/Support/286021/blinky/build/zephyr/zephyr.elf"
(y or n) [answered Y; input not from terminal]
Reading symbols from c:/Temp/Support/286021/blinky/build/zephyr/zephyr.elf...
2
Resetting target

Temporary breakpoint 2, main () at zephyr/include/generated/syscalls/device.h:43
43		compiler_barrier();

Breakpoint 1, main () at ../src/main.c:48
48			led_is_on = !led_is_on;
Here is the output from terminal
[2022-03-17T14:15:25.200Z] SERVER CONSOLE DEBUG: onBackendConnect: gdb-server session connected. You can switch to "DEBUG CONSOLE" to see GDB interactions.
"C:\\Program Files (x86)\\SEGGER\\JLink\\JLinkGDBServerCL.exe" -singlerun -nogui -if swd -port 50000 -swoport 50001 -telnetport 50002 -device nRF52840_xxAA -select usb=683376211 -rtos "C:\\Program Files (x86)\\SEGGER\\JLink\\GDBServer\\RTOSPlugin_Zephyr.dll"
SEGGER J-Link GDB Server V7.58b Command Line Version

JLinkARM.dll V7.58b (DLL compiled Nov 16 2021 15:00:10)

Command line: -singlerun -nogui -if swd -port 50000 -swoport 50001 -telnetport 50002 -device nRF52840_xxAA -select usb=683376211 -rtos C:\Program Files (x86)\SEGGER\JLink\GDBServer\RTOSPlugin_Zephyr.dll
-----GDB Server start settings-----
GDBInit file:                  none
GDB Server Listening port:     50000
SWO raw output listening port: 50001
Terminal I/O port:             50002
Accept remote connection:      localhost only
Generate logfile:              off
Verify download:               off
Init regs on start:            off
Silent mode:                   off
Single run mode:               on
Target connection timeout:     0 ms
------J-Link related settings------
J-Link Host interface:         USB
J-Link script:                 none
J-Link settings file:          none
------Target related settings------
Target device:                 nRF52840_xxAA
Target interface:              SWD
Target interface speed:        4000kHz
Target endian:                 little

Connecting to J-Link...
J-Link is connected.
Firmware: J-Link OB-SAM3U128-V2-NordicSemi compiled Feb  2 2021 16:47:20
Hardware: V1.00
S/N: 683376211
Feature(s): RDI, FlashBP, FlashDL, JFlash, GDB
Checking target voltage...
Target voltage: 3.30 V
Listening on TCP/IP port 50000
Connecting to target...
Connected to target
Waiting for GDB connection...Connected to 127.0.0.1
Reading all registers
Read 4 bytes @ address 0x000011F2 (Data = 0xF3BFB662)
Read 2 bytes @ address 0x000011F2 (Data = 0xB662)
Loading RTOS plugin: C:\Program Files (x86)\SEGGER\JLink\GDBServer\RTOSPlugin_Zephyr.dll...
RTOS plugin (API v1.1) loaded successfully
RTOS plugin: Loaded
Received symbol: _kernel (0x2000094C)
Received symbol: _kernel_openocd_offsets (0x00000000)
ERROR: Mandatory symbol _kernel_openocd_offsets not found.
Received monitor command: halt
Halting target CPU...
...Target halted (PC = 0x000011F2)
Received monitor command: reset
Resetting target
Downloading 16048 bytes @ address 0x00000000
Downloading 6480 bytes @ address 0x00003EB0
Comparing flash   [....................] Done.
Erasing flash     [....................] Done.
Programming flash [....................] Done.
Writing register (PC = 0x    164c)
Received monitor command: reset
Resetting target
Read 4 bytes @ address 0x0000164C (Data = 0xF3802000)
Read 2 bytes @ address 0x0000164C (Data = 0x2000)
Reading 64 bytes @ address 0x000003C0
Read 2 bytes @ address 0x0000043A (Data = 0xB2F5)
Read 2 bytes @ address 0x000003F4 (Data = 0xB570)
Setting breakpoint @ address 0x000003F4, Size = 2, BPHandle = 0x0001
Setting breakpoint @ address 0x0000043A, Size = 2, BPHandle = 0x0002
Starting target CPU...
...Breakpoint reached @ address 0x000003F4
Reading all registers
Removing breakpoint @ address 0x000003F4, Size = 2
Removing breakpoint @ address 0x0000043A, Size = 2
Read 4 bytes @ address 0x000003F4 (Data = 0x4816B570)
Reading register (MSP = 0x20001D20)
Reading register (PSP = 0x20001390)
Reading register (PRIMASK = 0x       0)
Reading register (BASEPRI = 0x       0)
Reading register (FAULTMASK = 0x       0)
Reading register (CONTROL = 0x       2)
Reading register (FPSCR = 0x       0)
Reading register (s0 = 0x       0)
Reading register (s1 = 0x       0)
Reading register (s2 = 0x       0)
Reading register (s3 = 0x       0)
Reading register (s4 = 0x       0)
Reading register (s5 = 0x       0)
Reading register (s6 = 0x       0)
Reading register (s7 = 0x       0)
Reading register (s8 = 0x       0)
Reading register (s9 = 0x       0)
Reading register (s10 = 0x       0)
Reading register (s11 = 0x       0)
Reading register (s12 = 0x       0)
Reading register (s13 = 0x       0)
Reading register (s14 = 0x       0)
Reading register (s15 = 0x       0)
Reading register (s16 = 0x       0)
Reading register (s17 = 0x       0)
Reading register (s18 = 0x       0)
Reading register (s19 = 0x       0)
Reading register (s20 = 0x       0)
Reading register (s21 = 0x       0)
Reading register (s22 = 0x       0)
Reading register (s23 = 0x       0)
Reading register (s24 = 0x       0)
Reading register (s25 = 0x       0)
Reading register (s26 = 0x       0)
Reading register (s27 = 0x       0)
Reading register (s28 = 0x       0)
Reading register (s29 = 0x       0)
Reading register (s30 = 0x       0)
Reading register (s31 = 0x       0)
Reading register (d0 = 0x       0)
Reading register (d1 = 0x       0)
Reading register (d2 = 0x       0)
Reading register (d3 = 0x       0)
Reading register (d4 = 0x       0)
Reading register (d5 = 0x       0)
Reading register (d6 = 0x       0)
Reading register (d7 = 0x       0)
Reading register (d8 = 0x       0)
Reading register (d9 = 0x       0)
Reading register (d10 = 0x       0)
Reading register (d11 = 0x       0)
Reading register (d12 = 0x       0)
Reading register (d13 = 0x       0)
Reading register (d14 = 0x       0)
Reading register (d15 = 0x       0)
Read 4 bytes @ address 0x00003430 (Data = 0x7B134A03)
Reading 64 bytes @ address 0x20001380
Read 4 bytes @ address 0x00004884 (Data = 0xFB64F7FF)
Read 4 bytes @ address 0x000013DC (Data = 0x2000094C)
Read 4 bytes @ address 0x20000964 (Data = 0x00000000)
Reading 64 bytes @ address 0x20000940
Read 4 bytes @ address 0x20000964 (Data = 0x00000000)
Setting breakpoint @ address 0x0000043A, Size = 2, BPHandle = 0x0003
Starting target CPU...
...Breakpoint reached @ address 0x0000043A
Reading all registers
Removing breakpoint @ address 0x0000043A, Size = 2
Read 4 bytes @ address 0x0000043A (Data = 0x2100B2F5)
Reading register (MSP = 0x20001D20)
Reading register (PSP = 0x20001380)
Reading register (PRIMASK = 0x       0)
Reading register (BASEPRI = 0x       0)
Reading register (FAULTMASK = 0x       0)
Reading register (CONTROL = 0x       2)
Reading register (FPSCR = 0x       0)
Reading register (s0 = 0x       0)
Reading register (s1 = 0x       0)
Reading register (s2 = 0x       0)
Reading register (s3 = 0x       0)
Reading register (s4 = 0x       0)
Reading register (s5 = 0x       0)
Reading register (s6 = 0x       0)
Reading register (s7 = 0x       0)
Reading register (s8 = 0x       0)
Reading register (s9 = 0x       0)
Reading register (s10 = 0x       0)
Reading register (s11 = 0x       0)
Reading register (s12 = 0x       0)
Reading register (s13 = 0x       0)
Reading register (s14 = 0x       0)
Reading register (s15 = 0x       0)
Reading register (s16 = 0x       0)
Reading register (s17 = 0x       0)
Reading register (s18 = 0x       0)
Reading register (s19 = 0x       0)
Reading register (s20 = 0x       0)
Reading register (s21 = 0x       0)
Reading register (s22 = 0x       0)
Reading register (s23 = 0x       0)
Reading register (s24 = 0x       0)
Reading register (s25 = 0x       0)
Reading register (s26 = 0x       0)
Reading register (s27 = 0x       0)
Reading register (s28 = 0x       0)
Reading register (s29 = 0x       0)
Reading register (s30 = 0x       0)
Reading register (s31 = 0x       0)
Reading register (d0 = 0x       0)
Reading register (d1 = 0x       0)
Reading register (d2 = 0x       0)
Reading register (d3 = 0x       0)
Reading register (d4 = 0x       0)
Reading register (d5 = 0x       0)
Reading register (d6 = 0x       0)
Reading register (d7 = 0x       0)
Reading register (d8 = 0x       0)
Reading register (d9 = 0x       0)
Reading register (d10 = 0x       0)
Reading register (d11 = 0x       0)
Reading register (d12 = 0x       0)
Reading register (d13 = 0x       0)
Reading register (d14 = 0x       0)
Reading register (d15 = 0x       0)
Reading 64 bytes @ address 0x20001380
Read 4 bytes @ address 0x00003430 (Data = 0x7B134A03)
Read 4 bytes @ address 0x00004884 (Data = 0xFB64F7FF)
Read 4 bytes @ address 0x000013DC (Data = 0x2000094C)
Read 4 bytes @ address 0x20000964 (Data = 0x00000000)
Reading 64 bytes @ address 0x20000940
Read 4 bytes @ address 0x20000964 (Data = 0x00000000)
I'm not able to reproduce what you are referring to.
Can you please open the Command Palette in VS Code and type in nRF Connect: Generate support information, and please provide the output here.
Thanks.
Kind regards,
Øyvind
David, thanks for providing this screenshot. I see that the error is generated by the Cortex-Debug extension which is not ours, but installed by our extension I believe. Not sure why I didn't get the same pop-up, but I do have the same error reported by the Cortex-Debug extension. 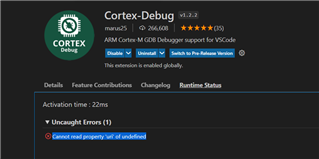
I'm investigating and will get back to you as soon as I have more information.
Kind regards,
Øyvind