gdb commands to list Zephyr app threads?

Hello Devzone Community,

I am developing an nRF9160 based firmware for a battery powered device, and am attempting to examine the firmware using `gdb` at the command line.  I have a JLink debugger from Segger as my physical debugging and programming device.  I have Segger's JLink utilities installed on an Ubuntu 20.04 LTS host.  The JLinkGDBServer version is 7.60.

My firmware is based on Nordic Semi ncs v1.6.1, and also has some basis yet specifically on Nordic's sample app `aws_iot`.  While the aws_iot sample app is not designed to automatically enter nRF9160's lowest power modes for a particular time period, my understanding is that all the low power modes and features of the nRF9160 are achievable with proper amendments in firmware to this sample app.

My present goal is to see a complete listing of Zephyr RTOS and application (my specific app code) threads in a remote gdb debugging session.  I'm able to start Segger's JLinkGDBServer and the GNU cross debugger at the command line, and interact some with my nRF9160 + Zephyr firmware.  I also have Zephyr's thread analyzer module enabled in my project Kconfig settings in file prj.conf.  But I get a disagreement between the threads that Zephyr RTOS 2.6.0 reports and what threads gdb with Segger's Zephyr RTOS plugin sees.

Excerpt 1 - Zephyr thread analyzer reported threads:

   1) 'at_cmd_socket_thread'     stack size 1472 bytes, stack used 432 bytes, 29%
   2) 'thread_simple_cli'        stack size 4096 bytes, stack used 1768 bytes, 43%
   3) 'time_thread'              stack size 1024 bytes, stack used 240 bytes, 23%
   4) 'sysworkq'                 stack size 2048 bytes, stack used 168 bytes, 8%
   5) 'idle 00'                  stack size 320 bytes, stack used 56 bytes, 17%

Excerpt 2 - gdb reported threads:

(gdb) thread find [a-z0-9]
Thread 1 has target id 'Thread 57005'
Thread 2 has target id 'Remote target'

At gdb's prompt I have also tried the command which is mentioned in this Memfault dot com gdb tutorial.  There's a lot of gdb I have yet to learn, but the following command appears to be a shorthand way to request a backtrace of all threads in the remote application.

Excerpt 3 - gdb command to show backtrace of threads:

(gdb) thread apply all bt
[New Remote target]

Thread 2 (Remote target):
#0  z_arm_reset () at /home/ted/projects/zephyr-based/zephyr/arch/arm/core/aarch32/cortex_m/reset.S:69

Thread 1 (Thread 57005):
#0  z_arm_reset () at /home/ted/projects/zephyr-based/zephyr/arch/arm/core/aarch32/cortex_m/reset.S:69

This listing of backtraces however is short lived.  In a given gdb session, the second and later times I invoke this command the report gives only Thread 2 has extent and having a backtrace to report.

Question (1)  Is there a sequence of debugging commands I must issue, to put firmware into a state where the debugger can correctly report Zephyr and app threads?

Question (2)  should Segger's Zephyr RTOS plugin shared object file support gdb to list the same threads which Zephyr itself reports?

- Ted

  • Hi,


    In the project itself, you should add this configuration

    ncs v1.6.0 or newer:

    CONFIG_DEBUG_THREAD_INFO=y

    Older versions of ncs, like v1.5.x:

    CONFIG_OPENOCD_SUPPORT=y

    I am using the sample zephyr/samples/basic/threads for testing.

    Start up JLink GDB server in one terminal window:


    JLinkGDBServer -if swd -device nrf9160_xxaa -rtos /opt/SEGGER/JLink/GDBServer/RTOSPlugin_Zephyr.so

    Then you attach manually via gdb:

    arm-none-eabi-gdb path/to/build/zephyr/zephyr.elf

    And connect to the server:

    target remote localhost:2331

    You should see this when attaching:

    ...
    Loading RTOS plugin: //opt/SEGGER/JLink/GDBServer/RTOSPlugin_Zephyr.so...
    ...


    In the gdb console, write:

    load
    mon reset
    b blink1 # or any other symbol you'd like to break on
    c
    # when hitting breakpoint
    info threads


    And the output of "info threads" should be:

    >>> info threads 
      Id   Target Id                                     Frame 
      2    Thread 536872048 (idle 00 UNKNOWN PRIO 15)    z_thread_entry (entry=0x4121 <idle>, p1=0x20000d04 <_kernel>, p2=0x0 <z_impl_z_errno>, p3=0x0 <z_impl_z_errno>) at /opt/ncs/zephyr/lib/os/thread_entry.c:29
      3    Thread 536871520 (blink0_id SUSPENDED PRIO 7) arch_swap (key=key@entry=0x0) at /opt/ncs/zephyr/arch/arm/core/aarch32/swap.c:53
    * 4    Thread 536871696 (blink1_id RUNNING PRIO 7)   blink1 () at /opt/ncs/zephyr/samples/basic/threads/src/main.c:97
      5    Thread 536871872 (uart_out_id QUEUED PRIO 7)  z_thread_entry (entry=0x405 <uart_out>, p1=0x0 <z_impl_z_errno>, p2=0x0 <z_impl_z_errno>, p3=0x0 <z_impl_z_errno>) at /opt/ncs/zephyr/lib/os/thread_entry.c:29


    Kind regards,

    Håkon

  • Good evening Håkon,

    Ted from the west coast writing.  I want to give you a thank you for these specific, spot on instructions to invoke gdb server, and arm-none-eabi-gdb client.  I've just gotten this to work and can finally see correct thread summary of running Nordic ncs, Zephyr based application.  Thank you!

    My apologies as well, I have been feverishly ( at times sloggingly ) working through coding and Kconfig modifications in order to correctly fully enter deep sleep mode with our nRF9160 based board design.  I have a longer running post regarding nRF9160 deep sleep configuration.  I have yet to solve this problem, but your team mate Didrik Rokhaug has provided some low power sample apps which build for the nRF9160DK.  I have one of these development boards on hand.  LTE modem firmware reports `%HWVERSION: nRF9160 SICA B1A` for our version of the nRF9160.

    Simple as these hello_world applications are it has taken some time to reach a build-able sample.  I needed to combine two of the samples to achieve what seems an unrealistic 46 nano-amps current draw from the nRF9160 SiP itself.  As I understand it, using PPK 2 connected to the DK board's P22 header measures current of the SiP only, not the external hardware.

    The work project I am developing on the firmware side is more complex.  Unfortunately I cannot make a simple symbol for symbol comparison of Didrik's low power hello world prj.conf against the work-related prj.conf file.  Closest I can get is to compare assignments of like symbols, then note the many extra symbols in the work project.  I am now reviewing each extra symbol -- many related to Nordic ncs aws_iot sample app -- one symbol at a time.  I am attempting to set each one to 'n'.  There are times this breaks the build, but I am trying to bring the work project Kconfig to match the hello_world low power config.  If I can match them, I should see low power on my custom board, or know that I've failed to turn off custom hardware outside the 9160.

    When I connect Nordic PPK2 device to nRF9160DK board in ampere meter mode, is it reasonable to see only tens of nano-amps as the SiP operates in deep sleep mode?  Or is this current measurement a sign that I have a mistake in my test configuration?

    My apology for changing topic question in my post reply.  Thank you again for the significant help with gdb server and Zephyr thread debugging!

    - Ted

  • Hi Ted,


    tedhavelka said:
    Ted from the west coast writing.  I want to give you a thank you for these specific, spot on instructions to invoke gdb server, and arm-none-eabi-gdb client.  I've just gotten this to work and can finally see correct thread summary of running Nordic ncs, Zephyr based application.  Thank you!

    I am glad to have helped out!

    tedhavelka said:

    Simple as these hello_world applications are it has taken some time to reach a build-able sample.  I needed to combine two of the samples to achieve what seems an unrealistic 46 nano-amps current draw from the nRF9160 SiP itself.  As I understand it, using PPK 2 connected to the DK board's P22 header measures current of the SiP only, not the external hardware.

    The work project I am developing on the firmware side is more complex.  Unfortunately I cannot make a simple symbol for symbol comparison of Didrik's low power hello world prj.conf against the work-related prj.conf file.  Closest I can get is to compare assignments of like symbols, then note the many extra symbols in the work project.  I am now reviewing each extra symbol -- many related to Nordic ncs aws_iot sample app -- one symbol at a time.  I am attempting to set each one to 'n'.  There are times this breaks the build, but I am trying to bring the work project Kconfig to match the hello_world low power config.  If I can match them, I should see low power on my custom board, or know that I've failed to turn off custom hardware outside the 9160.

    When I connect Nordic PPK2 device to nRF9160DK board in ampere meter mode, is it reasonable to see only tens of nano-amps as the SiP operates in deep sleep mode?  Or is this current measurement a sign that I have a mistake in my test configuration?

    My apology for changing topic question in my post reply.  Thank you again for the significant help with gdb server and Zephyr thread debugging!

    The PPK2 has a resolution of nano-meter in the lowest mode, as shown here:

    https://infocenter.nordicsemi.com/topic/ug_ppk2/UG/ppk/ppk_measure_resolution.html?cp=10_8_7_2_1

    However, it will not be able to measure consistently in the nano-amp range.


    Here's the numbers (ballpark) which you should see when the nRF9160 is in sleep:

    https://infocenter.nordicsemi.com/topic/ps_nrf9160/_tmp/alta.nRF9160/autodita/CURRENT/parameters.id_current_sleep.html?cp=2_0_0_4_5_0_1


    If you see lower nA numbers, then something is most likely wrong, ie. not properly powered or connected.

    Is the slider for "enable power output" highlighted?


    Kind regards,

    Håkon

  • Good day Håkon,

    To your question about Power Profile utility settings on my work station, yes, "Enable power output" slider is in the "on" position.  Is this correct?

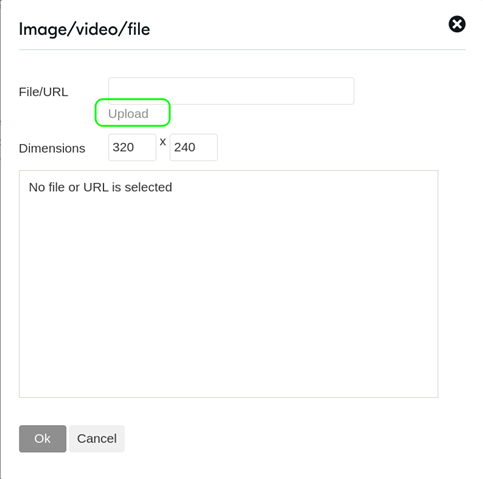
    I am curious too how may I attach images to public forum posts here?  When I go to "Insert -> Image/video/file" a dialog box appears which offers a simple text box only for a full (I take it absolute) path to an image file, or a web type URL to an image file.  No matter how I enter path or URL the image link remains broken.

    Not sure whether it helps, and I prefer to post images here on the forum itself but here is a window capture of Power Profiler this hour, running in this case low power hello_world code on a custom board, where I am still trying to rule in or rule out nRF9160 pin mis-configuration:

       *  wiki.neelanurseries.com/.../20220404

    Attempting to use "Format -> Formats -> Blocks -> p r e" I attempt to insert ASCII art in my post here as well, but the Javascript or similar based editing facility still strips out all consecutive white space characters beyond the first white space.

    Last week I wanted to include an image of my wiring config PC, PPKII and nRF9160DK board.  Unfortunately I have no way to include any format image in my posts.  Is there a Dedzone posting step I am missing?  Are image uploads only available when opening a private support ticket with Devzone?

    Thank you again, Håkon.

    - Ted

  • Good morning Ted,


    tedhavelka said:

    To your question about Power Profile utility settings on my work station, yes, "Enable power output" slider is in the "on" position.  Is this correct?

    I am curious too how may I attach images to public forum posts here?  When I go to "Insert -> Image/video/file" a dialog box appears which offers a simple text box only for a full (I take it absolute) path to an image file, or a web type URL to an image file.  No matter how I enter path or URL the image link remains broken.

    Yes, this is a bit counter intuitive, unfortunately, as the UI does not give a explicit "browse" button, but if you press the "upload" button, it shall give you a pop-up where you can attach a file:

    You can also drag-and-drop from a file explorer.


    The current you're seeing now is about ~300 uA, which could make sense, but it is hard to say without knowing if the firmware runs as expected.

    What example are you trying to run? Could you share this so that I can verify the current consumption?

    Which version of the nRF9160-DK are you using?


    Kind regards,

    Håkon

Related