Debugger stops after some wakeups only in debug mode.

Hi,

Using windows 10 OS, and SES v5.40.

I am using nRF52833 device in my project along with nRF5_SDK_for_Thread_and Zigbee_v4.1.0_32ce5f8 SDK.

I am running an application where it has to wakeup every 60 seconds and then goes to sleep.

I have I am trying to run the code in debug mode and printing some stuff for every wakeup as mentioned below.

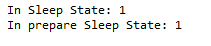
So it i start my application and leave it for some time i have to see this pringting several times.

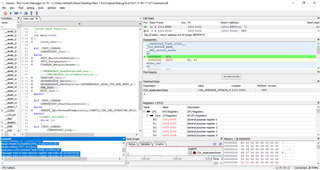
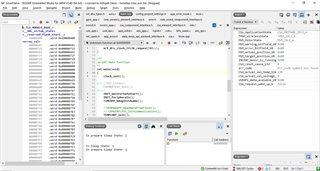
Problem : recently the debugger somehow goes to some part of code and it stops debuggiing and even debug reset doesnt work later.

When it gets stuck i cannot see rather the call stack and it stops the cursor pointing to some location in disassembly as below.


And the strange thing is it doesnt happend with release mode.

And i started facing this problem recently once i added some lines to my code and seems that if i comment any small part of code(anywhere) it works fine without problems.

Questions : 1. Is this some issue with the debugger settings?

                   2. Something related to the memory constraint? As i can see that memory is not really full and it can still accommodate RAM and Flash.

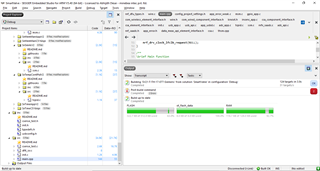
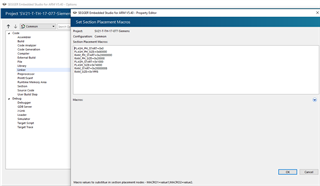
                   3. Is there any place where we have to set RAM space while we execute in debug mode?

Best regards

Abhijith Desai

  • Just for more information i tried to debug with OZONE debugger and found this log when ever the debugger stops.

    Disabled output of control characters

    J-Link software found at: C:/Program Files/SEGGER/Ozone V2.70/JLink_x64.dll

    Target core support plugin loaded.: C:/Program Files/SEGGER/Ozone V2.70/Plugins/Core/CorePluginARM.dll

    Project.SetDevice ("nRF52833_xxAA");

    Project.SetHostIF ("USB", "");

    Project.SetTargetIF ("SWD");

    Project.SetTIFSpeed ("4000");

    Project.AddSvdFile ("$(InstallDir)/Config/CPU/Cortex-M4F.svd");

    File path resolved: "$(InstallDir)/Config/CPU/Cortex-M4F.svd" was found at "C:/Program Files/SEGGER/Ozone V2.70/Config/CPU/Cortex-M4F.svd"

    RTT active

    File.Open: completed in 430 ms

    File.Open ("C:/Users/Abhijith.Desai/Desktop/New 1.9.0/Output/Debug/Exe/SV21-T-TH-17-077-Siemens.elf");

    246 source files not found

    Debug.Start();

    Device "NRF52833_XXAA" selected.

    InitTarget() start

    InitTarget() end

    Found SW-DP with ID 0x2BA01477

    DPIDR: 0x2BA01477

    CoreSight SoC-400 or earlier

    Scanning AP map to find all available APs

    AP[2]: Stopped AP scan as end of AP map has been reached

    AP[0]: AHB-AP (IDR: 0x24770011)

    AP[1]: JTAG-AP (IDR: 0x02880000)

    Iterating through AP map to find AHB-AP to use

    AP[0]: Core found

    AP[0]: AHB-AP ROM base: 0xE00FF000

    CPUID register: 0x410FC241. Implementer code: 0x41 (ARM)

    Found Cortex-M4 r0p1, Little endian.

    FPUnit: 6 code (BP) slots and 2 literal slots

    CoreSight components:

    ROMTbl[0] @ E00FF000

    [0][0]: E000E000 CID B105E00D PID 000BB00C SCS-M7

    [0][1]: E0001000 CID B105E00D PID 003BB002 DWT

    [0][2]: E0002000 CID B105E00D PID 002BB003 FPB

    [0][3]: E0000000 CID B105E00D PID 003BB001 ITM

    [0][4]: E0040000 CID B105900D PID 000BB9A1 TPIU

    [0][5]: E0041000 CID B105900D PID 000BB925 ETM

    Connected to target device.

    Reset: Halt core after reset via DEMCR.VC_CORERESET.

    Reset: Reset device via AIRCR.SYSRESETREQ.

    T-bit of XPSR is 0 but should be 1. Changed to 1.

    Elf.GetBaseAddr(); // returns 0x1000

    Target.ReadU32 (0x00001000); // returns 0x2001F000

    Target.SetReg ("SP", 0x2001F000);

    Target.ReadU32 (0x00001004); // returns 0x1201

    Target.SetReg ("PC", 0x1201);

    J-Link: Flash download: Bank 0 @ 0x00000000: Skipped. Contents already match

    Elf.GetBaseAddr(); // returns 0x1000

    Target.ReadU32 (0x00001000); // returns 0x2001F000

    Debugger tries to read unknown register with index 88 (0x00000058)

    Debugger tries to read unknown register with index 89 (0x00000059)

    Debugger tries to read unknown register with index 90 (0x0000005A)

    Target.SetReg ("SP", 0x2001F000);

    Target.ReadU32 (0x00001004); // returns 0x1201

    Target.SetReg ("PC", 0x1201);

    Executed J-Link command "SetRTTAddr 0x2000ce28"

    Debugger tries to read unknown register with index 88 (0x00000058)

    Debugger tries to read unknown register with index 89 (0x00000059)

    Debugger tries to read unknown register with index 90 (0x0000005A)

    Debug.Continue();

    Window.Show ("Call Stack");

    Window.Add ("Watched Data", "CSA_ApplicationState");

    Window.Add ("Data Graph", "CSA_ApplicationState");

    T-bit of XPSR is 0 but should be 1. Changed to 1.

    Debugger tries to read unknown register with index 88 (0x00000058)

    Debugger tries to read unknown register with index 89 (0x00000059)

    Debugger tries to read unknown register with index 90 (0x0000005A)

  • Hi,

    Do your application include BLE/softdevice, or is it Thread-only?

    Can you upload the full application, for us to reproduce/debug the issue? Usually, the only difference between debug and release mode is the DEBUG/DEBUG_NRF symbols, and the optimization level of the compiler. Have you made any other modifications to the project configurations?

    Best regards,
    Jørgen

  • Hi, 

    It is thread only, and along with the application we are running for a motor.

    and i was just trying to modify certain settings with optimization levels, earlier it was set to "NONE" and i changed it to LEVEL 2 and it seems like that issue i reported doesnt exist, but we have problems with thread to join the network it halts at some point and doesnt proceed further.

    We are using DFU bootloader along with the current project, and we arranged the memory segment this way.

    Also we see different flash size when it is built in debug mode and release mode. 

    Thanks

    Abhijith

  • Hi,

    Abhijith.Desai said:
    we have problems with thread to join the network it halts at some point and doesnt proceed further.

    Can you post the log from the application and a sniffer trace showing the on-air communications when this issue occurs?

    Abhijith.Desai said:
    Also we see different flash size when it is built in debug mode and release mode. 

    This is expected if one configuration have the DEBUG/DEBUG_NRF symbols defined and the other does not. These symbols will include additional error handling/assert functions, along with debug strings, which will increase flash usage.

    Best regards,
    Jørgen

Related