This discussion has been locked.
You can no longer post new replies to this discussion. If you have a question you can start a new discussion

Visual Studio code GDB debugger debugs SPM and sometimes not my application

Setup Visual Studio Code and installed the toolchain manager stuff got 1.9.1 of the SDK and the command line stuff for my windows 10 machine (if that matters).  And trying to debug the blinky example on my nrf53 DK board.  Selected the NS version of the board. 

If I make changes (to the blink rate of the blinky app) and hit compile and flash everything works perfectly.  But if I go to debug (using GDB) it immediately goes to the SPM code and stops so I can hit run.
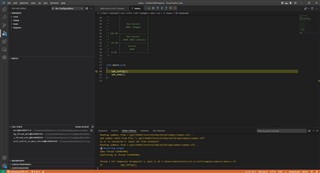
If I put a breakpoint in main of the blinky app, and hit run it never gets in there.  I can debug and step through the SPM project. 

Then the next day, it started with the SPM code and after hitting run it jumped into the main of the blinky app.  And then I could debug.  But that only lasted for a day, and now I'm stuck in the SPM project again and it run and debugs that but never jumps into my blinky code.  I don't know what I did to get it to run that one time or why it's not running.  Contacted my FAE and his version of the blinky project never runs (or debugs) the SPM. 

I'm assuming this is a configuration issue.  I basically setup and am trying to do this https://academy.nordicsemi.com/topic/dissecting-blinky/  but it's not always jumping into my program.  Just the SPM.

  • Hi,

    When it is built with NS version, the program will start from spm_config() and spm_jump().The function spm_config() will set the security attribute of the peripherals depending on the default configurations in its associated Kconfig file. It will set the flash regions after the SPM location, as Non-Secure, while the RAM regions after the first 64 kB are set as Non-Secure. The function spm_jump() will make the application jump to a Non-Secure partition (e.g. the non-secure user application). 

    I cannot reproduce the issue with NCS v1.9.1 \zephyr\samples\basic\blinky and VSCode v1.67.1 either. Can you try the unmodified blinky sample again? 

    Regards,
    Amanda

  • At the moment it's working as you describe.  There were a couple days where spm_jump() wasn't jumping into my application and I am not sure why.  But it's working as you describe now. 

    But even with the unmodified blinky example, I'm getting: Not a valid ELF file "executable": "c:/git\ZBS01\Test2\blinky2\build\zephyr\merged.hex". Many debug functions may not work

    That's not normal is it?


    Warn: c:/git\ZBS01\Test2\blinky2\build\zephyr\merged.hex is not an ELF file format. Some features won't work -- Globals, Locals, disassembly, etc.Launching GDB: "c:\\Users\\sminnick\\ncs\\v1.9.1\\toolchain\\opt\\bin\\arm-none-eabi-gdb.exe" -q --interpreter=mi2 "c:/git\\ZBS01\\Test2\\blinky2\\build\\zephyr\\merged.hex"
        Set "showDevDebugOutput": "raw" in your "launch.json" to see verbose GDB transactions here. Helpful to debug issues or report problems
    Launching gdb-server: "C:\\Program Files (x86)\\SEGGER\\JLink\\JLinkGDBServerCL.exe" -singlerun -nogui -if swd -port 50000 -swoport 50001 -telnetport 50002 -device nRF5340_xxAA_APP -select usb=1050050870 -rtos "C:\\Program Files (x86)\\SEGGER\\JLink\\GDBServer\\RTOSPlugin_Zephyr.dll"
        Please check TERMINAL tab (gdb-server) for output from C:\Program Files (x86)\SEGGER\JLink\JLinkGDBServerCL.exe
    Reading symbols from c:/git\ZBS01\Test2\blinky2\build\zephyr\merged.hex...
    (No debugging symbols found in c:/git\ZBS01\Test2\blinky2\build\zephyr\merged.hex)
    WARNING: Cortex-Debug will deprecate use of GDB version 8 after July 2022. Please upgrade to version 9+
    0x00007fc8 in ?? ()
    Program stopped, probably due to a reset and/or halt issued by debugger
    add symbol table from file "c:/git/ZBS01/Test2/blinky2/build/zephyr/zephyr.elf"
    (y or n) [answered Y; input not from terminal]
    Reading symbols from c:/git/ZBS01/Test2/blinky2/build/zephyr/zephyr.elf...
    add symbol table from file "c:/git/ZBS01/Test2/blinky2/build/spm/zephyr/zephyr.elf"
    (y or n) [answered Y; input not from terminal]
    Reading symbols from c:/git/ZBS01/Test2/blinky2/build/spm/zephyr/zephyr.elf...
    2
    Resetting target
    [New Remote target]
    [Switching to Remote target]

    Thread 2 hit Temporary breakpoint 2, main () at C:/Users/sminnick/ncs/v1.9.1/nrf/samples/spm/src/main.c:55
    55        spm_config();
    [New Thread 536903904]
    [Switching to Thread 536904080]

    Thread 2 hit Breakpoint 1, main () at ../src/main.c:47
    47            gpio_pin_set(dev, PIN, (int)led_is_on);

  • I got my environment working.  I'm not sure what was causing the problems I was seeing.  Debugging to my application was intermittent (worked some days and not others).  Then got "not valid elf file" warnings. 

    I had tried uninstalling Visual Studio Code and uninstalling the nordic stuff but that wasn't cleaning out the system.  Reinstall visual studio code and all the extensions were already there.  Also removal and reinstall of the extensions didn't fix anything. 

    What DID fix my problems was to uninstall Visual Studio code, and uninstall all the nordic stuff.  Delete the install directory for the SDK (where ever you chose to put it).  Finally before re-installing anything, delete:

    %UserProfile%\.vscode

    %AppData%\nrfconnect

    When uninstalling things, these 2 directories and the SDK directory did not get removed.  And I assume something got messed up in there.  After deleting those directories and reinstalling things as per the standard setup instructions, everything is working. 

    Hope that helps someone else.  It caused me weeks of headache. 

Related