SDK Version: 1.9.1
Tool Chain Version: 1.9.1
Cortex Debug Extension Version: v1.4.4
I'm unable to debug my nRF9160 project using VSCode Debugger Extension. The same project can be debugged with zero issues using Segger Embedded Studio. This leads me to believe there is something not working with the VSCode Debugger.
I'm using a custom board whose definition is derived from nRF9160DK devicetree and configurations in V1.8.0. So I have three images in the build - MCUBoot (immutable), SPM, and Application.
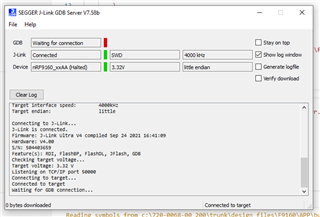
The following log is obtained when the issue occurred.
Debug Console
Cortex-Debug: VSCode debugger extension version 1.5.1 git(89a84bd). Usaage info: https://github.com/Marus/cortex-debug#usage

Warn: d:/Projects\TCP\Pallet\Source\Gateway\gateway_app\build_dbg\zephyr\merged.hex is not an ELF file format. Some features won't work -- Globals, Locals, disassembly, etc.Launching GDB: "c:\\ncs\\v1.9.1\\toolchain\\opt\\bin\\arm-none-eabi-gdb.exe" -q --interpreter=mi2 "d:/Projects\\TCP\\Pallet\\Source\\Gateway\\gateway_app\\build_dbg\\zephyr\\merged.hex"

    IMPORTANT: Set "showDevDebugOutput": "raw" in "launch.json" to see verbose GDB transactions here. Very helpful to debug issues or report problems
Launching gdb-server: "C:\\Program Files (x86)\\SEGGER\\JLink\\JLinkGDBServerCL.exe" -singlerun -nogui -if swd -port 50000 -swoport 50001 -telnetport 50002 -device nRF9160_xxAA -select usb=51017929 -rtos "C:\\Program Files (x86)\\SEGGER\\JLink\\GDBServer\\RTOSPlugin_Zephyr.dll"
    Please check TERMINAL tab (gdb-server) for output from C:\Program Files (x86)\SEGGER\JLink\JLinkGDBServerCL.exe
WARNING: Cortex-Debug will deprecate use of GDB version 8 after July 2022. Please upgrade to version 9+
Reading symbols from d:/Projects\TCP\Pallet\Source\Gateway\gateway_app\build_dbg\zephyr\merged.hex...
(No debugging symbols found in d:/Projects\TCP\Pallet\Source\Gateway\gateway_app\build_dbg\zephyr\merged.hex)
0x00000440 in ?? ()
Program stopped, probably due to a reset and/or halt issued by debugger
add symbol table from file "d:/Projects/TCP/Pallet/Source/Gateway/gateway_app/build_dbg/zephyr/zephyr.elf"
(y or n) [answered Y; input not from terminal]
Reading symbols from d:/Projects/TCP/Pallet/Source/Gateway/gateway_app/build_dbg/zephyr/zephyr.elf...
add symbol table from file "d:/Projects/TCP/Pallet/Source/Gateway/gateway_app/build_dbg/mcuboot/zephyr/zephyr.elf"
(y or n) [answered Y; input not from terminal]
Reading symbols from d:/Projects/TCP/Pallet/Source/Gateway/gateway_app/build_dbg/mcuboot/zephyr/zephyr.elf...
add symbol table from file "d:/Projects/TCP/Pallet/Source/Gateway/gateway_app/build_dbg/spm/zephyr/zephyr.elf"
(y or n) [answered Y; input not from terminal]
Reading symbols from d:/Projects/TCP/Pallet/Source/Gateway/gateway_app/build_dbg/spm/zephyr/zephyr.elf...
Debug Terminal
[2022-06-08T00:36:10.214Z] SERVER CONSOLE DEBUG: onBackendConnect: gdb-server session connected. You can switch to "DEBUG CONSOLE" to see GDB interactions.
"C:\\Program Files (x86)\\SEGGER\\JLink\\JLinkGDBServerCL.exe" -singlerun -nogui -if swd -port 50000 -swoport 50001 -telnetport 50002 -device nRF9160_xxAA -select usb=51017929 -rtos "C:\\Program Files (x86)\\SEGGER\\JLink\\GDBServer\\RTOSPlugin_Zephyr.dll"
SEGGER J-Link GDB Server V7.58b Command Line Version

JLinkARM.dll V7.58b (DLL compiled Nov 16 2021 15:00:10)

Command line: -singlerun -nogui -if swd -port 50000 -swoport 50001 -telnetport 50002 -device nRF9160_xxAA -select usb=51017929 -rtos C:\Program Files (x86)\SEGGER\JLink\GDBServer\RTOSPlugin_Zephyr.dll
-----GDB Server start settings-----
GDBInit file:                  none
GDB Server Listening port:     50000
SWO raw output listening port: 50001
Terminal I/O port:             50002
Accept remote connection:      localhost only
Generate logfile:              off
Verify download:               off
Init regs on start:            off
Silent mode:                   off
Single run mode:               on
Target connection timeout:     0 ms
------J-Link related settings------
J-Link Host interface:         USB
J-Link script:                 none
J-Link settings file:          none
------Target related settings------
Target device:                 nRF9160_xxAA
Target interface:              SWD
Target interface speed:        4000kHz
Target endian:                 little

Connecting to J-Link...
J-Link is connected.
Firmware: J-Link V11 compiled Nov 16 2021 11:59:06
Hardware: V11.00
S/N: 51017929
Feature(s): GDB
Checking target voltage...
Target voltage: 2.72 V
Listening on TCP/IP port 50000
Connecting to target...
Connected to target
Waiting for GDB connection...Connected to 127.0.0.1
Reading all registers
Read 4 bytes @ address 0x00000440 (Data = 0x4B21B57F)
Read 2 bytes @ address 0x00000440 (Data = 0xB57F)
Loading RTOS plugin: C:\Program Files (x86)\SEGGER\JLink\GDBServer\RTOSPlugin_Zephyr.dll...
RTOS plugin (API v1.1) loaded successfully
RTOS plugin: Loaded
Received symbol: _kernel (0x200151C8)
Received symbol: _kernel_openocd_offsets (0x00035858)
Received symbol: z_sys_post_kernel (0x20015392)
All mandatory symbols successfully loaded.
Read 4 bytes @ address 0x00000440 (Data = 0x4B21B57F)
All mandatory symbols successfully loaded.
Read 4 bytes @ address 0x00000440 (Data = 0x4B21B57F)
All mandatory symbols successfully loaded.
Received monitor command: halt
Halting target CPU...
...Target halted (PC = 0x00000440)
Received monitor command: reset
Resetting target
Downloading 16096 bytes @ address 0x00000000
Downloading 4932 bytes @ address 0x00003EE0
Downloading 16128 bytes @ address 0x00008000
Downloading 16352 bytes @ address 0x0000BF00
Downloading 288 bytes @ address 0x0000FEE0
Downloading 16176 bytes @ address 0x00010000
Downloading 16128 bytes @ address 0x00013F30
Downloading 16048 bytes @ address 0x00017E30
Downloading 16016 bytes @ address 0x0001BCE0
Downloading 1168 bytes @ address 0x0001FB70
Downloading 16144 bytes @ address 0x00020000
Downloading 15920 bytes @ address 0x00023F10
Downloading 15952 bytes @ address 0x00027D40
Downloading 15968 bytes @ address 0x0002BB90
Downloading 1552 bytes @ address 0x0002F9F0
Downloading 15984 bytes @ address 0x00030000
Downloading 16240 bytes @ address 0x00033E70
Downloading 16256 bytes @ address 0x00037DE0
Downloading 6448 bytes @ address 0x0003BD60
Comparing flash   [....................] Done.
Writing register (PC = 0x       0)
Received monitor command: reset
Resetting target
Read 4 bytes @ address 0x00000000 (Data = 0x20011388)
Read 2 bytes @ address 0x00000000 (Data = 0x1388)
Reading 64 bytes @ address 0x0000BCC0
Read 2 bytes @ address 0x00000440 (Data = 0xB57F)
Read 2 bytes @ address 0x00012310 (Data = 0xB538)
Read 2 bytes @ address 0x0000BCE4 (Data = 0xB508)
Reading register (MSP = 0x20011388)
Reading register (PSP = 0x       0)
Reading register (PRIMASK = 0x       0)
Reading register (BASEPRI = 0x       0)
Reading register (FAULTMASK = 0x       0)
Reading register (CONTROL = 0x       0)
Reading register (FPSCR = 0x       0)
Reading register (s0 = 0x       0)
Reading register (s1 = 0x       0)
Reading register (s2 = 0x       0)
Reading register (s3 = 0x       0)
Reading register (s4 = 0x       0)
Reading register (s5 = 0x       0)
Reading register (s6 = 0x       0)
Reading register (s7 = 0x       0)
Reading register (s8 = 0x       0)
Reading register (s9 = 0x       0)
Reading register (s10 = 0x       0)
Reading register (s11 = 0x       0)
Reading register (s12 = 0x       0)
Reading register (s13 = 0x       0)
Reading register (s14 = 0x       0)
Reading register (s15 = 0x       0)
Reading register (s16 = 0x       0)
Reading register (s17 = 0x       0)
Reading register (s18 = 0x       0)
Reading register (s19 = 0x       0)
Reading register (s20 = 0x       0)
Reading register (s21 = 0x       0)
Reading register (s22 = 0x       0)
Reading register (s23 = 0x       0)
Reading register (s24 = 0x       0)
Reading register (s25 = 0x       0)
Reading register (s26 = 0x       0)
Reading register (s27 = 0x       0)
Reading register (s28 = 0x       0)
Reading register (s29 = 0x       0)
Reading register (s30 = 0x       0)
Reading register (s31 = 0x       0)
Reading register (d0 = 0x       0)
Reading register (d1 = 0x       0)
Reading register (d2 = 0x       0)
Reading register (d3 = 0x       0)
Reading register (d4 = 0x       0)
Reading register (d5 = 0x       0)
Reading register (d6 = 0x       0)
Reading register (d7 = 0x       0)
Reading register (d8 = 0x       0)
Reading register (d9 = 0x       0)
Reading register (d10 = 0x       0)
Reading register (d11 = 0x       0)
Reading register (d12 = 0x       0)
Reading register (d13 = 0x       0)
Reading register (d14 = 0x       0)
Reading register (d15 = 0x       0)
Reading register (MSP_S = 0x20011388)
Reading register (MSPLIM_S = 0x       0)
Reading register (PSP_S = 0x       0)
Reading register (PSPLIM_S = 0x       0)
Reading register (MSP_NS = 0x       0)
Reading register (MSPLIM_NS = 0x       0)
Reading register (PSP_NS = 0x2000F780)
Reading register (PSPLIM_NS = 0x       0)
Reading register (CONTROL_S = 0x       0)
Reading register (FAULTMASK_S = 0x       0)
Reading register (BASEPRI_S = 0x       0)
Reading register (PRIMASK_S = 0x       0)
Reading register (CONTROL_NS = 0x       0)
Reading register (FAULTMASK_NS = 0x       0)
Reading register (BASEPRI_NS = 0x       0)
Reading register (PRIMASK_NS = 0x       0)
Setting breakpoint @ address 0x00000440, Size = 2, BPHandle = 0x0001
Setting breakpoint @ address 0x0000BCE4, Size = 2, BPHandle = 0x0002
Setting breakpoint @ address 0x00012310, Size = 2, BPHandle = 0x0003
Starting target CPU...
...Breakpoint reached @ address 0x00000440
Parsed thread 655765532, next=0
Reading all registers
Read register 0 (4 bytes) from DLL: 04000000
Read register 1 (4 bytes) from DLL: 00000000
Read register 2 (4 bytes) from DLL: 01000000
Read register 3 (4 bytes) from DLL: A44F0000
Read register 4 (4 bytes) from DLL: AD220000
Read register 5 (4 bytes) from DLL: 20000000
Read register 6 (4 bytes) from DLL: 88EB0020
Read register 7 (4 bytes) from DLL: 00000000
Read register 8 (4 bytes) from DLL: 00000000
Read register 9 (4 bytes) from DLL: 00000000
Read register 10 (4 bytes) from DLL: 00000000
Read register 11 (4 bytes) from DLL: 00000000
Read register 12 (4 bytes) from DLL: 50050020
Read register 13 (4 bytes) from DLL: 80130120
Read register 14 (4 bytes) from DLL: C9220000
Read register 15 (4 bytes) from DLL: 40040000
Read register 16 (4 bytes) from DLL: 00000069
Removing breakpoint @ address 0x00000440, Size = 2
Removing breakpoint @ address 0x0000BCE4, Size = 2
Removing breakpoint @ address 0x00012310, Size = 2
I tried debugging one of sample, "nRF9160/AT Client", and the same custom board can be debugged fine.
Seeing how SDK V2.0.0 onwards no longer support Segger, I would like to sort this issue out once and for all before migrating to V2.0.0.