nrf5340 Stuck in SPM? Or my program crashes immediately? What would cause this?

I've been building a test application, and it's gotten bigger and bigger over time.  Everything compiles perfectly.  I'm building the ns version for the app core. nrf5340dk_nrf5340_cpuappns

It's not that big yet:

Memory region         Used Size  Region Size  %age Used
           FLASH:       33072 B       960 KB      3.36%
            SRAM:        4744 B       480 KB      0.97%
        IDT_LIST:          0 GB         2 KB      0.00%

I put a breakpoint in the SPM at spm_jump() just for fun

void main(void)
{
    spm_config();
    spm_jump();
}

I debug and it stops at spm_jump() and then goes to my code.  Everything was working well. 

I did something like this


void function1(void)
{
    printk("function1\n");
}

void function2(void)
{
    printk("function2\n");
}

void spiread(uint32_t array[],uint32_t total)
{
    uint32_t counter = 0;

    return;
}

void main(void)
{

    printk("------- Starting -----\n");

    uint32_t dataBuffer[256];
    uint32_t dataCounter = 0;

    function1();

    function2();

    while (1)
    {
        spiread(dataBuffer, dataCounter);

        k_msleep(1000);
    }
}


And everything runs, it went from the spm to my code and runs.  I'm simplifying here, function1 actually read from the i2c bus, but it all worked.  function2 sent data to a spi device and programmed it, 17 different registers, read back it all worked. 

I added spiread function and as you see it, it worked. 

BUT... when I do this?


void function1(void)
{
    printk("function1\n");
}

void function2(void)
{
    printk("function2\n");
}

void spiread(uint32_t array[],uint32_t total)
{
    uint32_t counter = 0;
    printk("spiread function\n");
    return;
}

void main(void)
{

    printk("------- Starting -----\n");

    uint32_t dataBuffer[256];
    uint32_t dataCounter = 0;

    function1();

    function2();

    while (1)
    {
        spiread(dataBuffer, dataCounter);

        k_msleep(1000);
    }
}

Suddenly, the spm runs, and nothing gets printed and it immediately comes back to the spm, like the device rebooted.  My breakpoint on the spm_jump() stops there, I hit continue and it stops there again and again and again.  It never printk's anything.  I comment out the printk line in my spiread function, it works again and I get all the output from my code. 

If I pass a pointer to the variable dataCounter, it fails.  Pass by value?  Works.  If I try to change the spiread() function to return a variable like the counter I defined?  fails.  The spm always runs.  I put breakpoints in my code, but they never get executed.  I never get my ------- Starting ----- message.

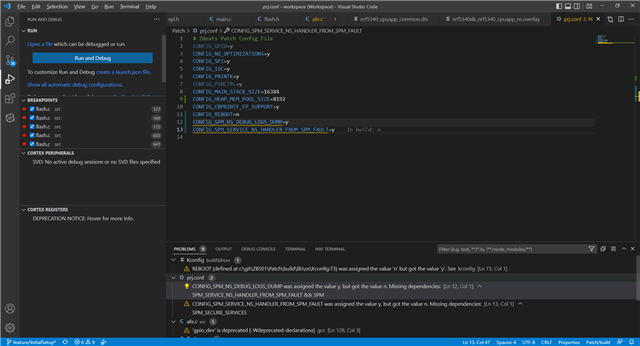
This is my proj.conf

CONFIG_GPIO=y
CONFIG_NO_OPTIMIZATIONS=y
CONFIG_NFCT_PINS_AS_GPIOS=y
CONFIG_SPM=y

CONFIG_PRINTK=y

CONFIG_SPI=y

#I2C
CONFIG_I2C=y
CONFIG_I2C_NRFX=y

But what would cause an immediate crash of my application code by just adding some more things to a function like this.  I know I simplified the other functions a lot, but they work fine when I don't try to print from the spiread() function.  That one I'm not simplifying.  The whole program seems to crash or not get out of the spm when I add the simplest things.

Any thoughts? 

  • Hello,

    can you set CONFIG_REBOOT=n and get the error message printed in the log?

  • I put that in my prj.conf but I'm not sure it changed any behavior.  It still loops in the SPM and if my code runs at all it immediately goes right back into the SPM and runs again.  Maybe I missed something, debug log below

    Reading symbols from c:/nordicsemi\v1.9.1\toolchain\opt\bin\arm-none-eabi-objdump.exe --syms -C -h -w c:\git\ZBS01\fund_less2_exer1\build\zephyr\merged.hex
    Reading symbols from c:/nordicsemi/v1.9.1\toolchain\opt\bin\arm-none-eabi-nm.exe --defined-only -S -l -C -p c:\git\ZBS01\fund_less2_exer1\build\zephyr\merged.hex
    Launching GDB: "c:\\nordicsemi\\v1.9.1\\toolchain\\opt\\bin\\arm-none-eabi-gdb.exe" -q --interpreter=mi2 "c:\\git\\ZBS01\\fund_less2_exer1\\build\\zephyr\\merged.hex"
        Set "showDevDebugOutput": true in your "launch.json" to see verbose GDB transactions here. Helpful to debug issues or report problems
    Launching gdb-server: "C:\\Program Files (x86)\\SEGGER\\JLink\\JLinkGDBServerCL.exe" -singlerun -nogui -if swd -port 50000 -swoport 50001 -telnetport 50002 -device nRF5340_xxAA_APP -select usb=504503362 -rtos "C:\\Program Files (x86)\\SEGGER\\JLink\\GDBServer\\RTOSPlugin_Zephyr.dll"
        Please check TERMINAL tab (gdb-server) for output from C:\Program Files (x86)\SEGGER\JLink\JLinkGDBServerCL.exe
    Finished reading symbols from objdump: Time: 64 ms
    Finished reading symbols from nm: Time: 61 ms
    Reading symbols from c:\git\ZBS01\fund_less2_exer1\build\zephyr\merged.hex...
    (No debugging symbols found in c:\git\ZBS01\fund_less2_exer1\build\zephyr\merged.hex)
    WARNING: Cortex-Debug will deprecate use of GDB version 8 after July 2022. Please upgrade to version 9+
    0x00007fce in ?? ()
    Program stopped, probably due to a reset and/or halt issued by debugger
    add symbol table from file "c:/git/ZBS01/fund_less2_exer1/build/zephyr/zephyr.elf"
    (y or n) [answered Y; input not from terminal]
    Reading symbols from c:/git/ZBS01/fund_less2_exer1/build/zephyr/zephyr.elf...
    add symbol table from file "c:/git/ZBS01/fund_less2_exer1/build/spm/zephyr/zephyr.elf"
    (y or n) [answered Y; input not from terminal]
    Reading symbols from c:/git/ZBS01/fund_less2_exer1/build/spm/zephyr/zephyr.elf...
    Resetting target
    Resetting target
    [New Thread 536904248]
    [New Thread 536904072]
    [Switching to Thread 536904248]

    Thread 2 hit Temporary breakpoint 2, main () at C:/nordicsemi/v1.9.1/nrf/samples/spm/src/main.c:55
    55        spm_config();
    Debug-16: Enqueuing {"command":"disassemble","arguments":{"memoryReference":"0x00007fc8","offset":0,"instructionOffset":-200,"instructionCount":400,"resolveSymbols":true},"type":"request","seq":16}
    Note: We detected the following memory regions as valid using gdb "info mem" and "objdump -h"
        This information is used to adjust bounds only when normal disassembly fails.
    ================================================================================
      Using following memory regions for disassembly
    ================================================================================
          Size   VMA Beg   VMA End   LMA Beg   LMA End  Attributes
    ================================================================================
      Unfortunately, No memory information from gdb (or gdb-server). Will try to manage without
      ------------------------------------------------------------------------------
      0000c000  00000000  0000c000  --------  --------  (.sec1) contents alloc load
      00008270  00010000  00018270  --------  --------  (.sec2) contents alloc load
    ================================================================================
    Debug-16: Dequeuing...
    Debug: Gdb command: -data-disassemble -s 0x00007ca8 -e 0x000082e8 -- 5     1600 bytes
    Debug: data-disassemble -s 0x00007ca8 -e 0x000082e8 -- 5 => Found 636 instrunctions. 0 with source code, 636 without
    Debug-16: Elapsed time for Disassembly Request: 117 ms

    Thread 2 hit Breakpoint 1, main () at C:/nordicsemi/v1.9.1/nrf/samples/spm/src/main.c:56
    56        spm_jump();

    Thread 2 hit Breakpoint 1, main () at C:/nordicsemi/v1.9.1/nrf/samples/spm/src/main.c:56
    56        spm_jump();

    Thread 2 hit Breakpoint 1, main () at C:/nordicsemi/v1.9.1/nrf/samples/spm/src/main.c:56
    56        spm_jump();

    Thread 2 hit Breakpoint 1, main () at C:/nordicsemi/v1.9.1/nrf/samples/spm/src/main.c:56
    56        spm_jump();

  • I stumbled across what caused this since no one was able to answer this.  And it's not enough stack specified in my prj.conf file.  Now my question is how do you know you have enough stack?  Is there a way to check usage?  Or just wait till you get stuck in the SPM and assume you need more?

  • Generally you can use the thread analyzer to check stack usage.

    http://developer.nordicsemi.com/nRF_Connect_SDK/doc/1.9.1/zephyr/guides/debug_tools/thread-analyzer.html#thread-analyzer

    Since this is SPM, you might also want to set:

    # When enabled, non-secure logs are printed to UARTE0 when secure fault occurs
    CONFIG_SPM_NS_DEBUG_LOGS_DUMP=y
    CONFIG_SPM_SERVICE_NS_HANDLER_FROM_SPM_FAULT=y

  • I wasn't able to get anywhere with that.  And the config items you listed come up with a problem.

    I don't think it's the SPM failing but my program failing and for some reason (which I can't figure out how to determine) the SPM just reboots and reboots. 

    Are there any other ways to log or get information out somehow when your application crashes to help debugging?

Related