Power Consumption - Scanning and Advertising at same time - S140

Hi,

I'm working on a project using BLE via s140, everything works fine until I look more seriously at the current draw of the device.

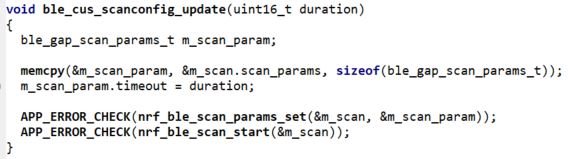
Simply, my project starts a Scan which lasts X milliseconds and which repeats every 20seconds. In parallel, the device advertises at interval Y milliseconds.

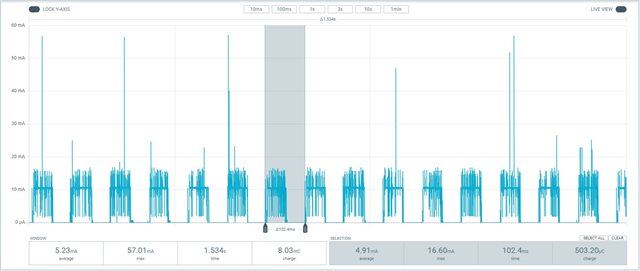
I use Power Profiler in order to obtain average consumption values and here are the results for different configurations.

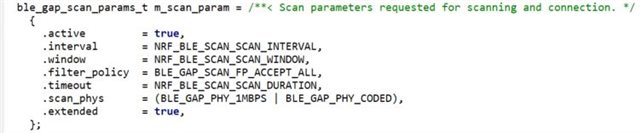
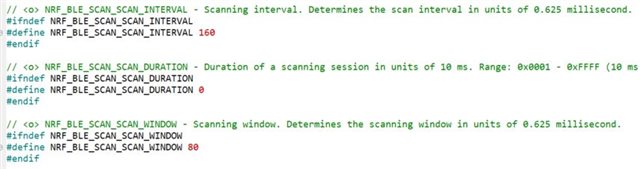
(Note : Scan_Interval = 100ms and Scan_window = 50ms)

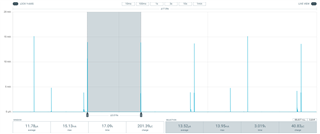
Scan duration  = 1s / Adv Interval = 100ms
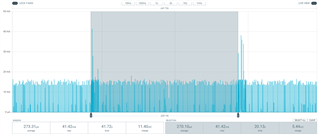
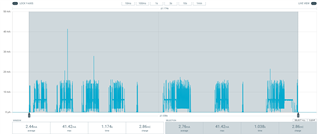
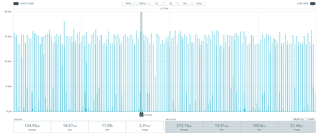
So we have:

  • Average = 273,31uA
  • Scan + Adv = 2,44mA
  • Adv = 134,93uA

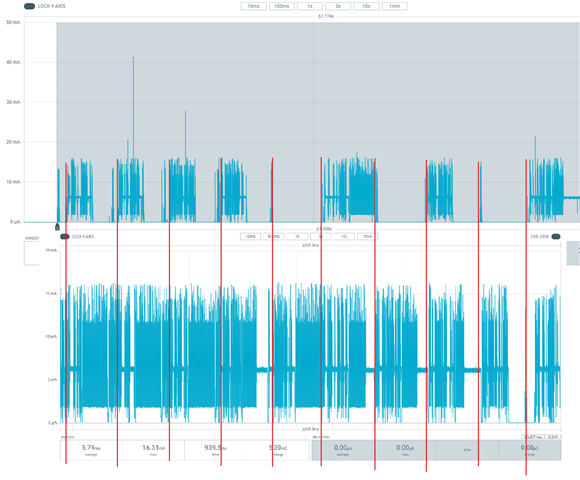
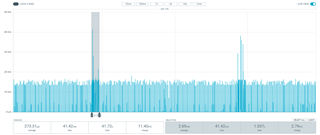
Scan duration  = 1s / Adv Interval = 3s
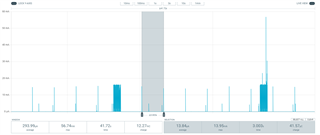
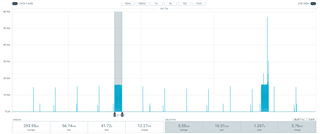
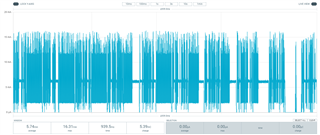
So we have:

  • Average = 293,99uA
  • Scan + Adv = 5,74mA
  • Adv = 11,78uA

My question is therefore: why when I increase the advertising interval, during Scan + Advertising, I get a significantly higher consumption ?

thanks for your support

Parents
  • Hi

    Sorry about the late reply, I was out of office for the Embedded World trade show last week, so I didn't have time to get back to you unfortunately.

    But, after looking closer at the Power profiler plots, it seems like the scan window might be causing trouble for you. The scanning process in the two scenarios draw ~2.5mA and ~5.5mA which is huge.

    If you compare the scanning plots you see that it scans with ~100 duty cycle on the last plot, vs. ~50% on the first one, see picture above. The red lines mark 100ms intervals. You say that the duty cycle of scanning is at 50% with Scan_Interval = 100ms and Scan_window = 50ms, which means that the top one is what we would expect, but it does seem like it still skips some scanning cycles and are sometimes "stuck" for 100ms.

    So it seems like the scanning might not work as intended, either due to the advertising aborting scanning, or by itself. Can you double check that the scan_window is indeed set to 50ms for both scenarios, and try turning off advertising entirely, and see if the scan windows for different intervals seem more correct then?

    Best regards,

    Simon

Reply
  • Hi

    Sorry about the late reply, I was out of office for the Embedded World trade show last week, so I didn't have time to get back to you unfortunately.

    But, after looking closer at the Power profiler plots, it seems like the scan window might be causing trouble for you. The scanning process in the two scenarios draw ~2.5mA and ~5.5mA which is huge.

    If you compare the scanning plots you see that it scans with ~100 duty cycle on the last plot, vs. ~50% on the first one, see picture above. The red lines mark 100ms intervals. You say that the duty cycle of scanning is at 50% with Scan_Interval = 100ms and Scan_window = 50ms, which means that the top one is what we would expect, but it does seem like it still skips some scanning cycles and are sometimes "stuck" for 100ms.

    So it seems like the scanning might not work as intended, either due to the advertising aborting scanning, or by itself. Can you double check that the scan_window is indeed set to 50ms for both scenarios, and try turning off advertising entirely, and see if the scan windows for different intervals seem more correct then?

    Best regards,

    Simon

Children
  • Hi Simonr,

    Thanks you for your answer!

    I have carried out some tests since our last exchanges and here are my conclusions:

    In order to use a sensor on our custom board, I had to implement its driver. Unfortunately too large, it was necessary to use optimization for memory (-02 for size). This caused, for some unknown reason, bluetooth packet transmission issues (seen last week). We decided to remove the use of the sensor temporarily in order to remove the optimization. As a result, the offsets you pointed to are no longer present.

    Only Scan:

    Scan + Adv 3s interval:

    Scan + Adv 100ms interval:

    We can discuss the optimization problem but let's focus on the consumption problem.

    I wanted a point of comparison. so I used the example code 
    ble_app_blinky_c_pca10056_s140.hex
     

    We can observe a difference with my graphs which, after some research, turns out 
    to come from the configuration of the scan and more precisely from
    ble_gap_scan_params_t.scan_phys


    The only place the scan configuration is changed is here to change the scan duration
    :


    I therefore remain in the misunderstanding of the consumption levels between
    the configurations.

    I also carried out tests by deleting the application code but 
    I obtain the same consumption results.


    Waiting for your feedback, I will adapt my code in order to test it
    on the PCA10056 evaluation board in order to have a common reference.

    Best Regards,

    Pegaze


Related