Debugging my nrf5sdk code using vs code via make file

I want to use this command nrfjprog --program .\nrf52840_xxaa.hex --sectorerase

and I had this error any idea about how to fix this?


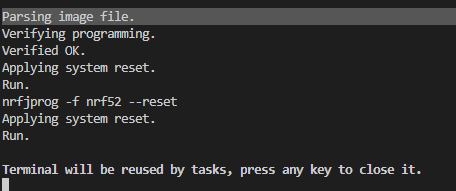
Parsing image file.

WARNING: A programming operation has been performed without --verify.
WARNING: Programming can fail without error.

Parents
  • Hi,


    To get rid of this warning, you can add "--verify" to the makefile, in this section as shown here:

    flash: default
    	@echo Flashing: $(OUTPUT_DIRECTORY)/nrf52840_xxaa.hex
    	nrfjprog -f nrf52 --program $(OUTPUT_DIRECTORY)/nrf52840_xxaa.hex --sectorerase --verify


    Kind regards,

    Håkon

  • Thank you for your request, 

    When I want to debug my program, I couldn't and I got this problem in my debug console, 

    Please check OUTPUT tab (Adapter Output) for output from C:/Program Files (x86)/SEGGER/JLink/JLinkGDBServerCL.exe
    Launching server: "C:/Program Files (x86)/SEGGER/JLink/JLinkGDBServerCL.exe" "-if" "swd" "-port" "50000" "-swoport" "50001" "-telnetport" "50002" "-device" "nrf52"
    Launching GDB: "C:\Program Files (x86)\GNU Arm Embedded Toolchain\10 2021.10\bin\arm-none-eabi-gdb.exe" "-q" "--interpreter=mi2"
    Reading symbols from C:\Users\ghaaz\Desktop\Hakim_byBaha-main\NewSDKFinal-main\examples\test\ble_app_uart_1\pca10056\s140\armgcc\_build\nrf52840_xxaa.out...
    0x00041d50 in delay_machine_code ()
    Not implemented stop reason (assuming exception): undefined

    Program
    received signal SIGTRAP, Trace/breakpoint trap.
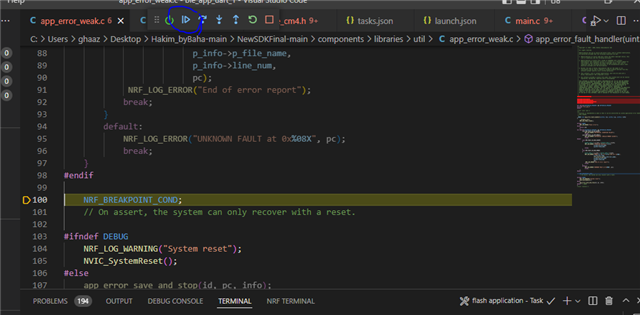
    0x00028bde in app_error_fault_handler (id=1, pc=88728, info=0) at ../../../../../../components/libraries/util/app_error_weak.c:100
    100 NRF_BREAKPOINT_COND;

    Program
    received signal SIGTRAP, Trace/breakpoint trap.
    0x00028bde in app_error_fault_handler (id=1, pc=88728, info=0) at ../../../../../../components/libraries/util/app_error_weak.c:100
    100 NRF_BREAKPOINT_COND;

    Program
    received signal SIGTRAP, Trace/breakpoint trap.
    0x00028bde in app_error_fault_handler (id=1, pc=88728, info=0) at ../../../../../../components/libraries/util/app_error_weak.c:100
    100 NRF_BREAKPOINT_COND;

    Temporary breakpoint 1, main () at ../../../main.c:2613
    2613 nrf_gpio_cfg_output(NRF_GPIO_PIN_MAP(1, 0));
    So can you help me ?
  • I clicked at reset and when I clicked this button 

    to continue debugging it couldn't continue, "and I did est by default every time that I start debugging"

    i can't run the problem with out clicking at step over, 

    And when it ran I can't see the printout in my terminal, I used RTT log console 

    have you an idea if  I have a problem in my launch or task.json file ?

  • I think the problem that  I want to see the print out with the Rtt console mode, any suggestion please

  • Hi,


    I'm assuming you're using S140 v7.2.0.

    If the assertion is equal to the former one, ie. occurring with pc=88728 (0x15a98), the issue is related to either debugging (ie. halt and resume) or that you have a timeslot which is exceeding its boundaries.


    Does your application run as expected if you don't enter debug mode?


    Kind regards,

    Håkon

  • Yes I'm working with s140 7.2.0 If I don't enter debug mode there is some issues when I run my application, it's not working like it did in Segger

  • Is it correct that your firmware runs as expected in normal mode (ie. not in debug mode) and the issue is that you're now not seeing RTT prints?

    Can you share your sdk_config.h?


    Kind regards,

    Håkon

Reply Children
No Data
Related