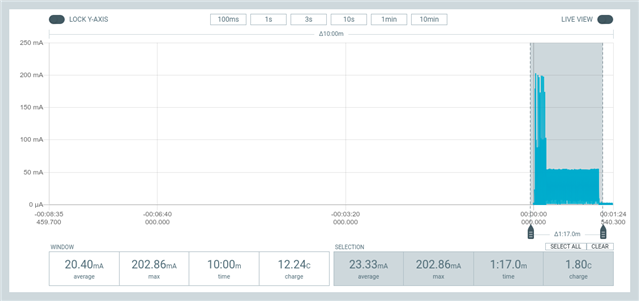
Using the nRF9160-DK together with the Power Profiler Kit 2, I observe sometimes a longer period (1 minute) of a 50mA consumption before entering PSM mode.
Is there a explanation for that? Could that behavior be "forecasted", or better disabled?

Using the nRF9160-DK together with the Power Profiler Kit 2, I observe sometimes a longer period (1 minute) of a 50mA consumption before entering PSM mode.
Is there a explanation for that? Could that behavior be "forecasted", or better disabled?

Hi,
What modem firmware are you using and what nRF Connect SDK (NCS) version are you on?
Regards,
Jonathan
modem 1.3.2
NCS 2.0.1
nrf connect for desktop 3.11.1, power profiler app 3.4.3
Just to mention:
My logs with PSM wakeup and sleep are matching the power consumption indicated by the PPK2. So, I guess, it's something happening in the modem, not an issue of the PPK2.
trace-2022-07-25T09-18-12.415Z.zip
The last message exchange results then in a 60s pause until sleep.
It's not too easy to have the Power Profile Kit also in place, but I hope the raw trace helps you to see the misery.
From the application log:
[00:01:40.092,803] <inf> COAP_CLIENT: 100 s, Thingy:91 v0.3, 0*3, 1*0, 2*0, 3*0, failures 0
[00:01:40.092,895] <inf> COAP_CLIENT: 5175 mV
[00:01:40.092,926] <inf> COAP_CLIENT: RSSI q,p: 255,255
[00:01:40.092,987] <inf> COAP_CLIENT: Network: CAT-M1
[00:01:40.093,078] <inf> COAP_CLIENT: PSM: 3600 s, Released: 11068 ms
[00:01:40.093,139] <inf> COAP_CLIENT: CoAP request prepared, token 0xeecbbfee, 148 bytes
[00:01:40.099,060] <inf> COAP_CLIENT: send_to_peer 184
[00:01:40.167,449] <inf> COAP_CLIENT: LTE modem wakes up
[00:01:40.723,602] <inf> COAP_CLIENT: RRC mode: Connected
[00:01:41.031,524] <inf> COAP_CLIENT: received_from_peer 167 bytes
[00:01:41.031,555] <inf> TINYDTLS: received message (167 bytes), starting with 'application_data', epoch 1
[00:01:41.031,616] <inf> TINYDTLS: got 'application_data' epoch 1 sequence 4 (167 bytes)
[00:01:41.032,379] <inf> TINYDTLS: ** application data:
[00:01:41.032,409] <inf> COAP_CLIENT: CoAP response received. code: 2.04, token 0xeecbbfee, 128 bytes
[00:01:41.032,409] <inf> COAP_CLIENT: payload: 100 s, Thingy:91 v0.3, 0*3, 1*0, 2*0, 3*0, failures 0
5175 mV
RSSI q,p: 255,255
Network: CAT-M1
PSM: 3600 s, Released: 11068 ms
[00:01:41.032,531] <inf> COAP_CLIENT: 4/629ms/938ms: success
[00:01:41.032,531] <inf> COAP_CLIENT: retrans: 0*4, 1*0, 2*0, 3*0, failures 0
[00:01:41.032,562] <inf> COAP_CLIENT: rtt: 0-2s: 4, 2-4s: 0, 4-6s: 0, 6-8s: 0, 8-10s: 0
[00:01:41.032,562] <inf> COAP_CLIENT: rtt: 10-12s: 0, 12-14s: 0, 14-16s: 0, 16-18s: 0, 18-20: 0
[00:01:41.032,592] <inf> COAP_CLIENT: rtt: avg. 1s (4#)
[00:01:41.032,592] <inf> COAP_CLIENT: vbat: 5175, 5171, 5179, 5148, 0
[00:01:41.032,623] <inf> COAP_CLIENT: 0, 0, 0, 0, 0
[00:01:52.025,787] <inf> COAP_CLIENT: RRC mode: Idle after 11302 ms (10994 ms inactivity)
[00:02:00.015,563] <inf> COAP_CLIENT: LTE modem sleeps
[00:02:33.159,149] <inf> COAP_CLIENT: 153 s, Thingy:91 v0.3, 0*4, 1*0, 2*0, 3*0, failures 0
[00:02:33.159,240] <inf> COAP_CLIENT: 5175 mV
[00:02:33.159,301] <inf> COAP_CLIENT: RSSI q,p: 255,255
[00:02:33.159,362] <inf> COAP_CLIENT: Network: CAT-M1
[00:02:33.159,454] <inf> COAP_CLIENT: PSM: 3600 s, Released: 10994 ms
[00:02:33.159,515] <inf> COAP_CLIENT: CoAP request prepared, token 0xefcbbfee, 148 bytes
[00:02:33.165,405] <inf> COAP_CLIENT: send_to_peer 184
[00:02:33.236,511] <inf> COAP_CLIENT: LTE modem wakes up
[00:02:33.775,878] <inf> COAP_CLIENT: RRC mode: Connected
[00:02:34.136,352] <inf> COAP_CLIENT: received_from_peer 167 bytes
[00:02:34.136,383] <inf> TINYDTLS: received message (167 bytes), starting with 'application_data', epoch 1
[00:02:34.136,444] <inf> TINYDTLS: got 'application_data' epoch 1 sequence 5 (167 bytes)
[00:02:34.137,176] <inf> TINYDTLS: ** application data:
[00:02:34.137,207] <inf> COAP_CLIENT: CoAP response received. code: 2.04, token 0xefcbbfee, 128 bytes
[00:02:34.137,237] <inf> COAP_CLIENT: payload: 153 s, Thingy:91 v0.3, 0*4, 1*0, 2*0, 3*0, failures 0
5175 mV
RSSI q,p: 255,255
Network: CAT-M1
PSM: 3600 s, Released: 10994 ms
[00:02:34.137,329] <inf> COAP_CLIENT: 5/615ms/977ms: success
[00:02:34.137,359] <inf> COAP_CLIENT: retrans: 0*5, 1*0, 2*0, 3*0, failures 0
[00:02:34.137,359] <inf> COAP_CLIENT: rtt: 0-2s: 5, 2-4s: 0, 4-6s: 0, 6-8s: 0, 8-10s: 0
[00:02:34.137,390] <inf> COAP_CLIENT: rtt: 10-12s: 0, 12-14s: 0, 14-16s: 0, 16-18s: 0, 18-20: 0
[00:02:34.137,390] <inf> COAP_CLIENT: rtt: avg. 1s (5#)
[00:02:34.137,420] <inf> COAP_CLIENT: vbat: 5175, 5175, 5171, 5179, 5148
[00:02:34.137,451] <inf> COAP_CLIENT: 0, 0, 0, 0, 0
[00:02:45.107,086] <inf> COAP_CLIENT: RRC mode: Idle after 11332 ms (10971 ms inactivity)
[00:03:41.611,358] <inf> COAP_CLIENT: LTE modem sleeps
Extract the "going to sleep":
[00:01:52.025,787] <inf> COAP_CLIENT: RRC mode: Idle after 11302 ms (10994 ms inactivity)
[00:02:00.015,563] <inf> COAP_CLIENT: LTE modem sleeps
(8 seconds,matchs active time, OK)
[00:02:45.107,086] <inf> COAP_CLIENT: RRC mode: Idle after 11332 ms (10971 ms inactivity)
[00:03:41.611,358] <inf> COAP_CLIENT: LTE modem sleeps
(60 seconds, drains the battery)
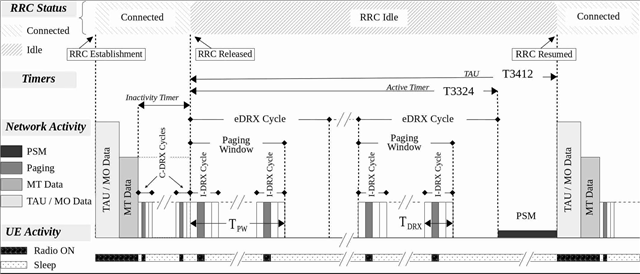
This could be the networks doing. Check with the network provider, aska about the inactivity timer, if the inactivity timer is on around 60 sec then that is the issue. 
There is little we can do if the network has long timers as this is not something we can control.
Regards,
Jonathan
I will ask there. What irritates me is, that it occurs randomly. Therefore I wrote
> ... sometimes ...
in my first message.
Tests afterwards showed something as 2 of 3 times the sleepmode was entered within time, and once not. So one registration, one +CPSMS, and several request (PTAU 3600, Act. 8s). And after each request the modem enters the sleep mode again, but sometimes with delays.
If I look at Power Consumption Charts I see, that in the active time the consumption is larger than the 50mA (maybe I wrong at that, I will check it again, when I'm able to spend some more time into this issue.)
You can check the Wire Shark trace see what is going on. so if you use the nrf connect app wit the trace collector V2 you can see if any data or packets is sent, what is interesting is if there is re-transmits. With different networks the time will be different, so if the device i roaming then it is expected to change from time to time.
Regards,
Jonathan
Maybe I miss something.
I added already such a trace in my comment 19 day ago (25. July 2022). I assumed that trace of the "additional 60s to sleep" are handed over to an expert to analyze it.
What is the result of that analysis by an expert?
A retransmission? I can't see that in this trace. A larger "inactivity time", I also can't see that.
The trace contains 3 message exchanges, where the device entered the sleep mode in time, and a forth (the last one in that trace), where it seems to miss the sleep mode. The last shows also, that it released the connection after 10s, so also the hint with the "inactivity timer" is strange to me, thought the trace shows the opposite. And the trace shows also no retransmission, which prevents the sleep mode.
Anyway, if it's not possible, that some experts have a look at the trace, that's OK for me. I'm only evaluating.