Hi,
We are evaluating Segger SystemView for analyzing our embedded applications. However, we encountered occasional overflows in SystemView. These overflows are caused by the logging module when set to deferred logging. The application runs on an nRF52833DK, but I used an external J-Link debugger to gather the trace data over RTT, because of the limited speed of the J-Link on the DK (I tested this too).
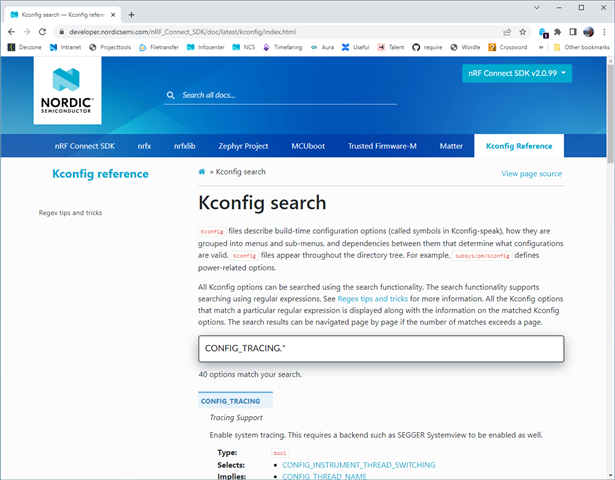
I took this guide from Zephyr as an example to configure the SystemView and Kconfig. I replicated this issue with the basic thread example project.
I noticed SystemView logs show "SWD speed too high. Reduced from 15000 kHz to 7593 kHz for stability". Is this a limitation of the nRF52833?
Is there a way to disable the trace data from the logging module?
Would it help to get a more powerful J-Link (i.e., J-Link pro)?
Are there other settings I could modify to allow this to work?
System information:
- NCS: V2.0.0
- J-LINK: Base Classic
- Log v2 mode deferred
- Project: Basic Thread Example
Configuration:
CONFIG_LOG=y
CONFIG_LOG_MODE_DEFERRED=y
CONFIG_HEAP_MEM_POOL_SIZE=256
CONFIG_ASSERT=y
CONFIG_GPIO=y

CONFIG_TRACING=y
CONFIG_SEGGER_SYSTEMVIEW=y
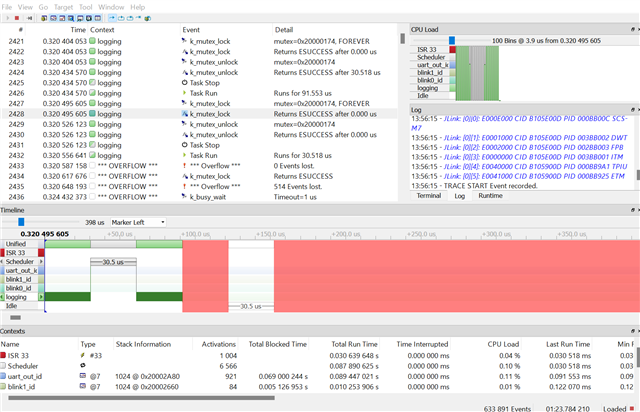
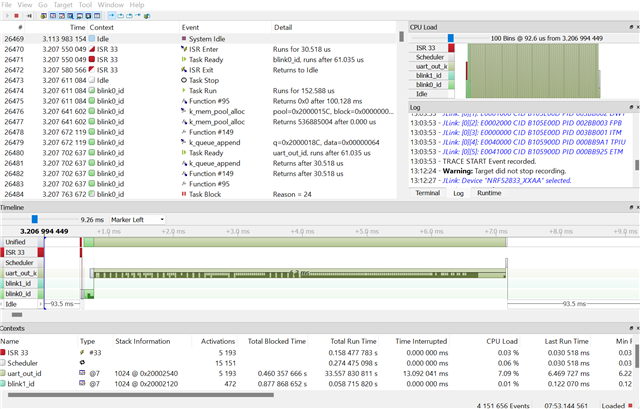
In the second image, only the setting `CONFIG_LOG_MODE_DEFERRED` changed to `CONFIG_LOG_MODE_IMMEDIATE`.
SystemView deferred logging:
SystemView immediate logging:
SystemView logs:
13:40:44 - JLink: Device "NRF52833_XXAA" selected.
13:40:44 - JLink: InitTarget() start
13:40:44 - JLink: InitTarget() end
13:40:44 - JLink: Failed to attach to CPU. Trying connect under reset.
13:40:45 - JLink: Found SW-DP with ID 0x2BA01477
13:40:45 - JLink: SWD speed too high. Reduced from 15000 kHz to 7593 kHz for stability
13:40:45 - JLink: DPIDR: 0x2BA01477
13:40:45 - JLink: CoreSight SoC-400 or earlier
13:40:45 - JLink: Scanning AP map to find all available APs
13:40:45 - JLink: AP[2]: Stopped AP scan as end of AP map has been reached
13:40:45 - JLink: AP[0]: AHB-AP (IDR: 0x24770011)
13:40:45 - JLink: AP[1]: JTAG-AP (IDR: 0x02880000)
13:40:45 - JLink: Iterating through AP map to find AHB-AP to use
13:40:45 - JLink: AP[0]: Core found
13:40:45 - JLink: AP[0]: AHB-AP ROM base: 0xE00FF000
13:40:45 - JLink: CPUID register: 0x410FC241. Implementer code: 0x41 (ARM)
13:40:45 - JLink: Found Cortex-M4 r0p1, Little endian.
13:40:45 - JLink: FPUnit: 6 code (BP) slots and 2 literal slots
13:40:45 - JLink: CoreSight components:
13:40:45 - JLink: ROMTbl[0] @ E00FF000
13:40:45 - JLink: [0][0]: E000E000 CID B105E00D PID 000BB00C SCS-M7
13:40:45 - JLink: [0][1]: E0001000 CID B105E00D PID 003BB002 DWT
13:40:45 - JLink: [0][2]: E0002000 CID B105E00D PID 002BB003 FPB
13:40:45 - JLink: [0][3]: E0000000 CID B105E00D PID 003BB001 ITM
13:40:45 - JLink: [0][4]: E0040000 CID B105900D PID 000BB9A1 TPIU
13:40:45 - JLink: [0][5]: E0041000 CID B105900D PID 000BB925 ETM
13:40:45 - TRACE START Event recorded.
Does anyone know how to solve this?
With kind regards,
Tim