nRF9160 - Any (complete) working examples with required code to get Segger Systemview working? Current Issue is SystemView Buffer Not Found

Hello,

I was wondering if there is a <complete> example someplace with Systemview running - an example for the nRF9160-DK would be nice.

I have the following in proj.conf:

CONFIG_SEGGER_SYSTEMVIEW=y
CONFIG_SEGGER_SYSTEMVIEW_BOOT_ENABLE=y
#CONFIG_UART_CONSOLE=n
#CONFIG_RTT_CONSOLE=y
# CONFIG_HAS_SEGGER_RTT=y
CONFIG_USE_SEGGER_RTT=y
CONFIG_SEGGER_SYSVIEW_RTT_BUFFER_SIZE=4096
CONFIG_SEGGER_SYSVIEW_SECTION_NONE=y

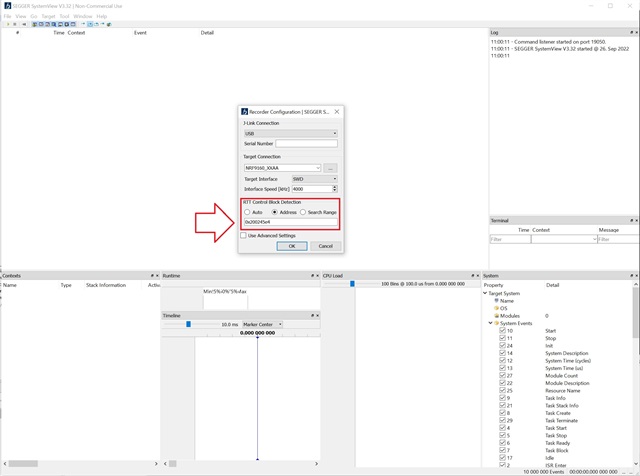
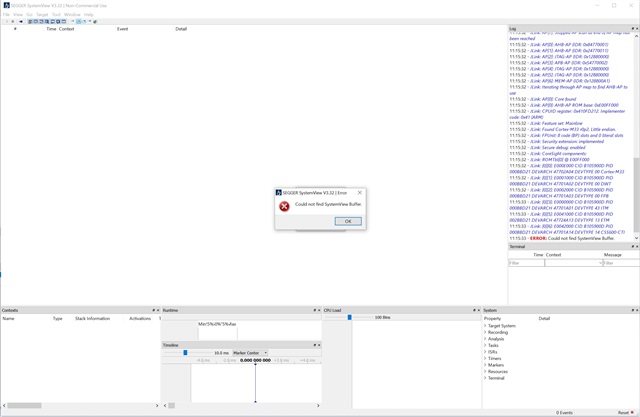
There's no issue with finding the RTT Block address - I see on some answers someone has said the Systemview Buffer issue and block address issue are the same - you can see in the attached the Systemview tool is finding the block address - you have to look in the zephyr map file and find the _SEGGER_RTT label - or you don't get past that.

An interesting tidbit - Systemview will run on the onboard MK22 on the nRF9160-DK.

Thanks In Advance,
John W.

Parents Reply Children
  • Hello Jonathan,

    Yes - it runs - I had to do some guessing with the project settings and memory allocation.  

    My overall goal here was to try and see what the runtime stack is plus available heap during runtime.  

    From the default project settings - 0x20000 bytes are set aside for the application - which is basically 1/2
    of the 0x40000 SRAM space that's available for heap (& runtime stack).  (On the nRF9160 M33.)

    I can see the stack for each task at runtime which is a nice feature - but I don't see a direct way to interrogate remaining heap (without adding code, hooks, etc possibly) using System View.

    From the .map file - which isn't as useful as the .map IAR provides - just says this (re: SRAM):

    Memory Configuration

    Name Origin Length Attributes
    FLASH 0x00010000 0x000ea000 xr
    SRAM 0x2000c4e8 0x00033b18 xw  -> 211,736 bytes allocated 
    IDT_LIST 0xfffff7ff 0x00000800 xw
    *default* 0x00000000 0xffffffff

    It's the only place where SRAM is even explicitly referenced.

    Maybe there are some linker options I can enable to get a better idea of how the SRAM is being used.

    But the overflow issue has been solved by letting the program grab from a yet unknown heap - at least I can't see it (yet).  There may be tools to look at what Zephyr is doing - like when you compile for the nRF52840 - you get 
    'thermometer bars' at the bottom after a successful compile that tell you how much FLASH and RAM your project is using before you download it - which is useful but I don't see that for the nRF9160.

    We do have an alloc that happens for some memory dedicated to packets over LTE-M - but that memory gets freed as soon as the packet transmission is done; I suppose there could be a memory leak there - but right now I don't see a way to find that with SystemView - as I'd hoped.  I know there's some 'instrumentation' code so to speak that can be added - maybe that's the only way to try and figure out how much heap I really have and/or do it like in the early days - just write a piece of test code that alloc's and dealloc's until I run out of memory to figure out how much runtime heap I have.

    I was hoping  sys_heap_runtime_stats_get() would work - but I notice this isn't very mature as it was just added to the Zephyr base approx. 1 year ago - and it's like 'who's on first?' - which heap do you/can you point to?  I guess there's no global heap structure in this code or pointer or high/low heap water mark that encompasses all of the heap that's available on the M33.  Or maybe I've just missed that for some reason.

    Regards,
    John

  • Seems to me that there is a underlying issue with a application you have that you are trying to solve. So not much more i can do with the info for now. But if you where to share what exactly you think the issue is and maybe share the .map file and\or logs\info of what is failing that might give me some better insight to what we are trying to solve.


    So this might fit better in a new ticket(private if that is to be preferred) if you feel that SystemView is working(but not in a fulfilling way), so if this a debugging issue then we can continue down that path.

    Regards,
    Jonathan

  • Jonathan,

    I appreciate your help and this discussion.

    Why don't we try to do something useful here that will benefit all?

    Is there a way to get heap stats out of System View - I'd rather focus on that vs. on some heap issue our particular app is having since I think in the future that will prove to be more useful.

    How many heaps does the nRF9160 Zephyr build really have.  Only 1/2 of the 0x40000 byte SRAM is allocated for the app heap - how to get a global pointer to that in such a way System View can display that - is it possible?

    I'm willing to spend more time on this if you are - and I think this is something that is needed and will be beneficial to all.

    Thanks,
    John W. 

  • Hi John,

    Don't have a answer to the two requests, but have some info to whoever looks at this in the future. 

    As an "alternative"
    There is some features that is now available in new VS code extension, we have a update video here: https://www.youtube.com/watch?v=UIwVY-qSmkY&t=408s 


    It is possible to use the memory report feature to get a overview of the device. 


    There is the Heap tracing API in Zephyr as well here https://docs.zephyrproject.org/latest/services/tracing/index.html#heaps 


    Regards,
    Jonathan

Related