Hallo,
I am currently trying to debug the Matter samples on the NRF5340 DK. They all work fine, but I have a problem with the "Thread Viewer" in VS Code while debugging on target.
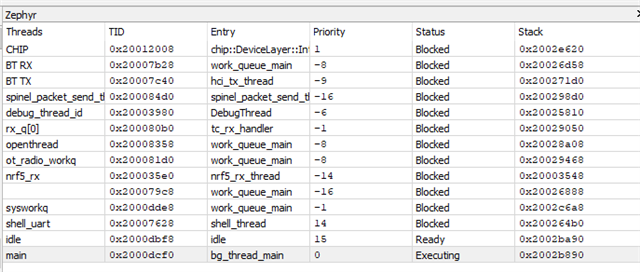
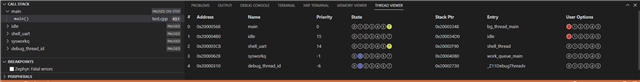
With other non-Matter Zephyr samples I had no issue opening the "Thread viewer" to see all Threads with their names, priorities, sates etc.
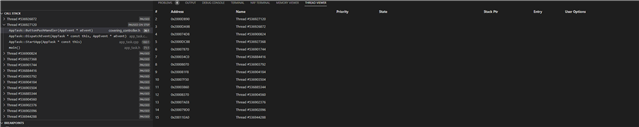
Whenever I try to debug a Matter sample it only shows Thread with some id number, which is not helpful. I want to know the names, priorities of the Threads used in the Matter samples.
Thanks for your attention. I’m looking forward to a reply.
Julius