application runs 9 times out of 10 NRF_ERROR_RESOURCES error free and then, once in a while, NRF_ERROR_RESOURCES massively present from the beginning

To the kind attention of Nordic support team,

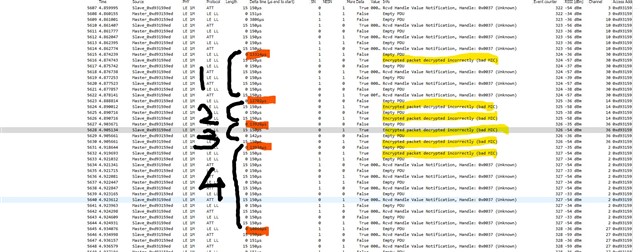
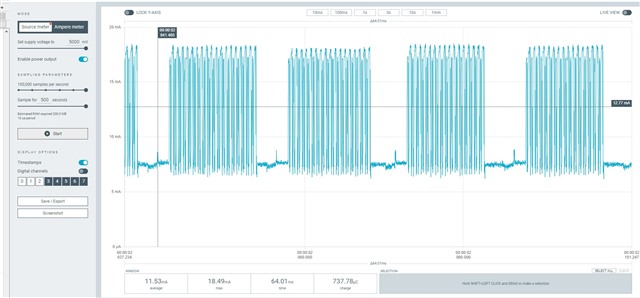
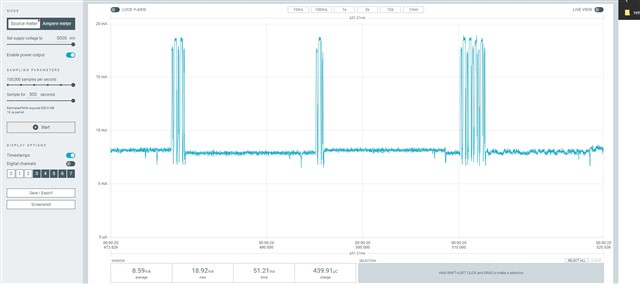
I'm testing a freertos project, with softdevice and radio notifications. A constant number of notifications is queued before the starting of the connection interval, and sent during the connection interval itself. It works very well, I get this high speed data stream. Every time I get a sporadic NRF_ERROR_RESOURCES, the feedback mechanism exploiting BLE_GATTS_EVT_HVN_TX_COMPLETE starts working as well, and the resource error disappear after a while.

Everything works fine, like 9 executions of the program out of 10 are really stable and NRF_ERROR_RESOURCES free. If I reset (Ctrl+Shift+F5 using Segger), it seems that, once in a while, from the beginning of the connection NRF_ERROR_RESOURCES is massively there, and it never goes away. Only reducing the number of queued notifications help.

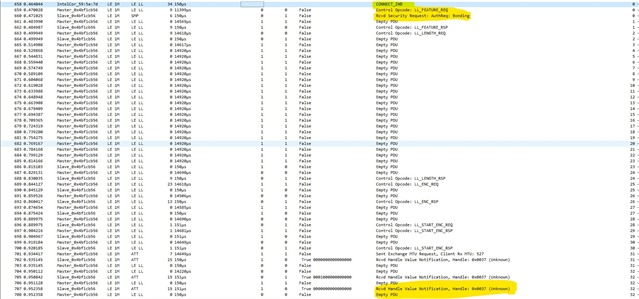
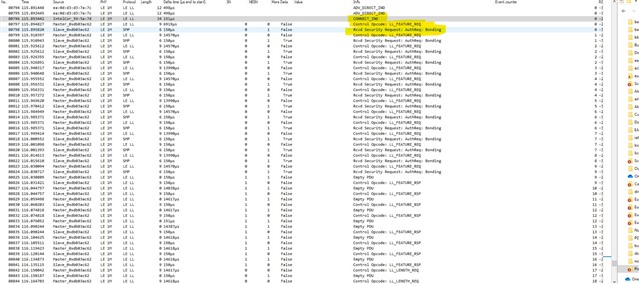
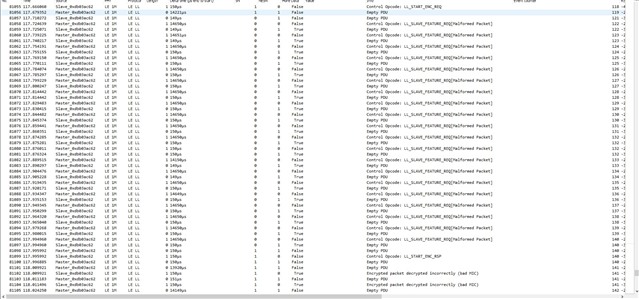
But why the number of notifications should be reduced once in a while? All this sounds to you like a problem in the application, or there could be something changing in the connection? I thought about master forcing a different connection interval than the desired one. But using BLE_GAP_EVT_CONN_PARAM_UPDATE_REQUEST I have no evidence for now that this behavior is due to a change in connection interval timing. I attached systemview files to the project and next days I'll be possibly able to post some more thing about this issue (also I'm gonna use Nordic sniffer). Really, just a quick opinion from your experts would be very much appreciated. Also, any debug strategy you would recommend.

Thank you in advance, best regards.

Parents
  • Hi Einar, I was using https://github.com/jimmywong2003/nrf52-ble-range-estimator as an example about how to properly monitor radio events as NRF_RADIO->EVENTS_TXREADY and NRF_RADIO->EVENTS_CRCOK. I got same results both when executing in my custom board and in pca10056. Still, I have this feeling that in my custom board, something is happening that is sometime spoiling softdevice activity, from the very beginning, so that it doesn't work properly and tx buffers are not able to empty themselves smoothly (once in a while buffered notifications number approach the reserved slots - gatts_conn_cfg.hvn_tx_queue_size- and the NRF_ERROR_RESOURCES starts to be fired). Is there any event register between softdevice used peripheral resources that could be check so to identify if softdevice is properly working? Or something went wrong during initialization? For example I'm monitoring NRF_CLOCK->EVENTS_DONE in my custom board, when softdevice appears to not work smoothly, and recalibration events seems to be ok. Is there something I could check about rtc0 status? timer0? Again, I cannot see this softdevice tx buffers malfunctioning  when running the very same test program in a  standard pca10056, that is why I'm incline to think it could be an hw issue.

    Best regards

  • Hi,

    astella said:
    I had the idea, as also suggested in one of your Nordic threads to test my program in a regular pca10056, and not in my custom hardware. It seems that there could be some activity - from my sensors - that is disturbing the antenna. When executing in pca10056, softdevice tx buffer fills up, but it never has a hard time emptying itself. While in my hardware lot of noise could be the root cause of retransmissions and not exploited connection intervals. I got these two screenshot using Nordic power profiler:

    It is interesting that you see a difference in the DK and your custom HW. But that could be explained by different things. Perhaps you are also not doing the same thing when running on the DK, because of lack of some external components? What are the differences when you run on the DK compared to your custom HW? The saw-tooth current consumption pattern here is eye catching - do you have any idea what it comes from?

    astella said:
    Is there any other debug technique you could please suggest in order to 100% validate this feeling? 

    If this is noice related (which could be, but it is not the first think would think of), then you would see that form a sniffer trace. This is one of the reasons I asked you about that before, but there are also other things we might see from that.

    astella said:
    Is there any event register between softdevice used peripheral resources that could be check so to identify if softdevice is properly working?

    Not really. Also, it is difficult to confirm that it is properly working. But the SoftDevice is very well tested, so without a strong indication that there is an issue with the SoftDevice, that would be one of the last things to consider. There are a lot of reasons why you may not be able to push as much data as you want.

    astella said:
    Again, I cannot see this softdevice tx buffers malfunctioning  when running the very same test program in a  standard pca10056, that is why I'm incline to think it could be an hw issue.

    Does the firmware also behave the same, or differently because of some external components? Can you describe your HW in a bit more detail? Also, can you describe what you firmware does other than sending notifications?

    I suggest the following next steps:

    1. Make a sniffer trace. Does that tell you something? For instance about retransmissions (which always happen in the next connection event), or something else? What about the MD (more dat) bit? Is that set as expected?
    2. Is the nRF doing something else, perhaps more in some situations that could prevent the SoftDevice from doing as much BLE activity as expected, like flash operations? What if you test without these activities? If you comment out most of your code except from sending dummy data, and gradually include more, perhaps you can quickly experimentally see which parts could be related. If so, what are those?
  • Hi Einar,

    "it is interesting that you see a difference in the DK and your custom HW. But that could be explained by different things. Perhaps you are also not doing the same thing when running on the DK, because of lack of some external components? What are the differences when you run on the DK compared to your custom HW? The saw-tooth current consumption pattern here is eye catching - do you have any idea what it comes from?"


    test program is just initializing softdevice and starts sending notifications, it makes no use of any additional hardware, not init any other mcu peripheral. yes, this custom board I'm testing has got additional hardware, in respect to pca10056. I could try and physically remove this additional hardware to experiment if I can get some improvement in ble communication/signals I see using power profiler.

    "If this is noice related (which could be, but it is not the first think would think of), then you would see that form a sniffer trace. This is one of the reasons I asked you about that before, but there are also other things we might see from that."

    this is part of trace data I collected. it is a little bit difficult for me to correctly understand what is going on. this is during a communication that appears to be spoiled from the beginning. I want to stress that this doesn't happen always. And seems to not happen at all when using pca10056. During connection interval 1) there is a packet that could be an incorrect packet sent from device. But the master is not closing immediately the connection interval. It is closing it after 3 more regular notifications and even if the more data flag is true. connection intervals 2) and 3) seems to experience serious troubles, receiving only incorrect packets, and they are closed almost immediately. Connection interval 4) begins with an incorrect packet, but it is able to go on for a while and closed again long before giving to the softdevice chance to send other queued notifications. For me it is not clear at all why the master is deciding to close the connection interval, and if this behaviour is in the first place cause by the device sending for some reason incorrect packets. Einar do you think that this "bad MIC" could be cause by noise that is spoiling softdevice performances? What guideline would you give in order to correctly interpret this kind of trace, what things you would search, based on your experience.


    "Does the firmware also behave the same, or differently because of some external components? Can you describe your HW in a bit more detail? Also, can you describe what you firmware does other than sending notifications?"

    yes, the fw behaves the same, regardless of external components. It is a mouse like hw. probably the optic sensor activity is producing current spikes comparable with ble communication ones. test fw is just sending notifications, that's all.

    Einar if you think it is the case, I could share in private the whole trace. Do you think, just out of curiosity, that a more sophisticated ble sniffer would be useful/more readable to better understand this issue? I must confess I have some trouble in understanding some details using the ble sniffer. Is there any Nordic guide about how to use it effectively for troubleshooting?

    Best regards

  • Hi,

    astella said:
    test program is just initializing softdevice and starts sending notifications, it makes no use of any additional hardware, not init any other mcu peripheral.

    I see, that is good to know. Then we can probably rule out the application.

    astella said:
    Einar do you think that this "bad MIC" could be cause by noise that is spoiling softdevice performances? What guideline would you give in order to correctly interpret this kind of trace, what things you would search, based on your experience.

    The sniffer clearly has the LTK as other packets are decrypted, so all these packets with bad MIC was not correctly received by the sniffer, even though the RSSI is good. That would indicate some noise or interference as you have suggested, and it seems likely that the central sees the same. I do not see the content of the packets from the screenshot (you could perhaps upload the full trace), but I would assume that if you look at the empty packets from the central you will see that before the long delta time that contains a NACK (and not an ACK), because the central did not receive the packet correctly. And in that case, the retransmission happens in the next connection event (per Bluetooth specification).

    In sum, it looks like the HW should be the focus area. Have you sent your HW to us for review? If not, can you share your HW files ans well as a description of it? Have you done some measurements on your HW to understand what it is doing? For instance, what is the cause of this saw tooth current consumption? What external components do you have on your board, and what are they doing? As this issue is not consistent, could it be that some of the external components (what ever they are) have floating pins or something else that causes the state to be undefined/vary, and in turn could generate noise?

    astella said:
    Einar if you think it is the case, I could share in private the whole trace. Do you think, just out of curiosity, that a more sophisticated ble sniffer would be useful/more readable to better understand this issue?

    Yes, the full trace will be useful (for the reasons explained above). Primarily just to verify the theory that the central NACKs. If you want to share something in private you can make a private case and refer to this one.

    astella said:
    I must confess I have some trouble in understanding some details using the ble sniffer. Is there any Nordic guide about how to use it effectively for troubleshooting?

    There are no specific guide for using it for troubleshooting, as that depends greatly on what the problem is. But the trace you have looks good and it looks like it captured what is relevant, so it is mostly a matter of interpreting it (as I have attempted to do earlier in this post, though I am missing some of the info from the trace).

    Update: I looked again and noticed not that the NESN/SN are shown in a column in the screenshot, so there is no need for the trace file. We can see that the packets are NACKed ad there are re transmissions, so the theory seems to hold water. The next step is to look more into the HW. 

  • Hi Einar, thank you very much for your support. It was very interesting. I'll update here as soon as we find something relevant about our custom hw.

    Best regards 

  • Hi Einar, we apparently fixed some hw problem in our board. And finally the communication is clean.

    Still I have this issue that when doing multiple resets in a rapid succession there is "once in a while" a communication that is struggling from the very beginning.

    To recap:

    I have this bared metal application that is ble connecting to an already bonded master, and starts to send notifications in a loop.

    Usually everything is really quick, it takes just a few passages before notifications are sent:

    Once in a while, things gets complicated and slow:

    1.

    2.

    3.

    4.

    5.

    6.

    Just a quick reset, and everything is ok again. Like in first screenshot. Is it possible for you to please share a patch for ble_app_hids_mouse program that is sending notifications in a loop, with this modifications https://jimmywongiot.com/2021/05/14/how-to-configure-the-number-of-packets-per-every-ble-connection-interval/ according to what you consider best practice to do that using latest sdk?  

    Using PPK2 is possible to see that connection interval is 15ms in both cases. If any interference, why should be present once in a while, and last indefinitely for the duration of the connection having troubles? I would like to understand if, once in a while, there is some sort of clock drift, that is causing this troubling communication. Is there any way you would recommend in order to check this?

    Thank you for your gentle attention, best regards 

  • Hi,

    astella said:
    Is it possible for you to please share a patch for ble_app_hids_mouse program that is sending notifications in a loop, with this modifications https://jimmywongiot.com/2021/05/14/how-to-configure-the-number-of-packets-per-every-ble-connection-interval/ according to what you consider best practice to do that using latest sdk?  

    I am not sure what you are after or why this post is relevant for this issue (where something cause a bunch of re transmissions), but I also do not know much of your code. To send as effectively as possible, you basically try to send notifications as much as possible in a loop, but when there is no room fore more, you wait for a BLE_GATTS_EVT_HVN_TX_COMPLETE before you continue. That is all there is to it. The ble_app_hids_keyboard (examples/ble_peripheral/ble_app_hids_keyboard/main.c) project already use the BLE_GATTS_EVT_HVN_TX_COMPLETE event in a similar manner, where it processes the buffer on every BLE_GATTS_EVT_HVN_TX_COMPLETE event, so that data is sent as fast as possible.

    astella said:
    If any interference, why should be present once in a while, and last indefinitely for the duration of the connection having troubles?

    I do not have a good explanation for that, and it is not expected. I suspect your application ends up in a bad state, but I cannot say more as I have not seen it. It should be possible to learn about this by debugging.

    astella said:
    I would like to understand if, once in a while, there is some sort of clock drift, that is causing this troubling communication. Is there any way you would recommend in order to check this?

    That is a good point, LF clock issues could very well be the root cause here. Which LF clock source do you use, and how is it configured (what are the NRF_SDH_CLOCK_LF_* set to in your sdk_config.h?). Are you able to reproduce this if you set  NRF_SDH_CLOCK_LF_SRC to 2? This will use a LF clk synthesized from the HF clock, so it will give a high current consumption, but it would be interesting to know if that resolves the issue. If so, we need to look more into your LF clock.

Reply
  • Hi,

    astella said:
    Is it possible for you to please share a patch for ble_app_hids_mouse program that is sending notifications in a loop, with this modifications https://jimmywongiot.com/2021/05/14/how-to-configure-the-number-of-packets-per-every-ble-connection-interval/ according to what you consider best practice to do that using latest sdk?  

    I am not sure what you are after or why this post is relevant for this issue (where something cause a bunch of re transmissions), but I also do not know much of your code. To send as effectively as possible, you basically try to send notifications as much as possible in a loop, but when there is no room fore more, you wait for a BLE_GATTS_EVT_HVN_TX_COMPLETE before you continue. That is all there is to it. The ble_app_hids_keyboard (examples/ble_peripheral/ble_app_hids_keyboard/main.c) project already use the BLE_GATTS_EVT_HVN_TX_COMPLETE event in a similar manner, where it processes the buffer on every BLE_GATTS_EVT_HVN_TX_COMPLETE event, so that data is sent as fast as possible.

    astella said:
    If any interference, why should be present once in a while, and last indefinitely for the duration of the connection having troubles?

    I do not have a good explanation for that, and it is not expected. I suspect your application ends up in a bad state, but I cannot say more as I have not seen it. It should be possible to learn about this by debugging.

    astella said:
    I would like to understand if, once in a while, there is some sort of clock drift, that is causing this troubling communication. Is there any way you would recommend in order to check this?

    That is a good point, LF clock issues could very well be the root cause here. Which LF clock source do you use, and how is it configured (what are the NRF_SDH_CLOCK_LF_* set to in your sdk_config.h?). Are you able to reproduce this if you set  NRF_SDH_CLOCK_LF_SRC to 2? This will use a LF clk synthesized from the HF clock, so it will give a high current consumption, but it would be interesting to know if that resolves the issue. If so, we need to look more into your LF clock.

Children
  • Hi Einar, thank you for your suggestion. For the moment is not solving the issue, though. I wanted to ask if any imprecision in main quartz load capacitance could give such an intermittent behavior, in your opinion. 

    Best regards

  • Yes, it could. If the crystal is incorrectly loaded, the frequency will be off. And also, if you have configured the SoftDevice incorrectly, specifying a better clock source accuracy then you actually have, that could give similar problems.

    Can you share your clock configuration (the NRF_SDH_CLOCK_* defines from your sdk_config.h)? Also, which LF clock source do you use? If a crystal, can you let me know which exact crystal you are using and the value of your load caps?

    The above was about the LF clock source which is normally the main suspect in such cases. It is theoretically possible that there is an issue with your HF crystal as well, but I would expect that to manifest itself differently. It could be worth checking anyway though (just verifying that the load caps are calculated as explained in General PCB design guidelines for nRF52 series.

  • Hi Einar,

    Thank you for your suggestions. We are not using external xtal as 32.768Hz oscillator. So we are setting 

    NRF_SDH_CLOCK_LF_SRC 0

    NRF_SDH_CLOCK_LF_RC_CTIV 16

    NRF_SDH_CLOCK_LF_RC_TEMP_CTIV 16 // other values tested

    NRF_SDH_CLOCK_LF_ACCURACY 1

    In SoftDevice specification is briefly mentioned that timing warning about HFXO startup time. We will be

    doing such measurements as well. I'm curious about what "not correct operation" would mean, though. 

    This is our main quartz. According to your suggestion C21,22 should be

    C21,22 = 2*Cl - Cpcb - Cpin = 2 * 10 - Cpcb - 3

    Supposing "similar layout to Nordic layout" and Cpcb = 1pF 

    2 * 10 - 3 - 1 about 16pF

    We have 12pF mounted for the moment. We will try to do rf measurements to understand if Cload trimming is needed

    Best regards

  • Hi,

    The config looks roughly OK, but the recommendation is to set NRF_SDH_CLOCK_LF_RC_TEMP_CTIV to 2 when using LFRC in order to do calibration often enough even if the temperature has not changed.

    There is little in the described behavior that points to an issue with the HFCLK, but as you write the load caps should be about 16 pF in your case, so that should anyway be fixed.

    astella said:
    doing such measurements as well. I'm curious about what "not correct operation" would mean, though. 

    This is mostly about timing. For instance, the Bluetooth stack needs to enable the HFXO a certain amount of time before using the radio so that the frequency is not off etc.

Related