This post is older than 2 years and might not be relevant anymore
More Info: Consider searching for newer posts

Eclipse CDT, GDB debugging with nRF51822: breaks on every line.

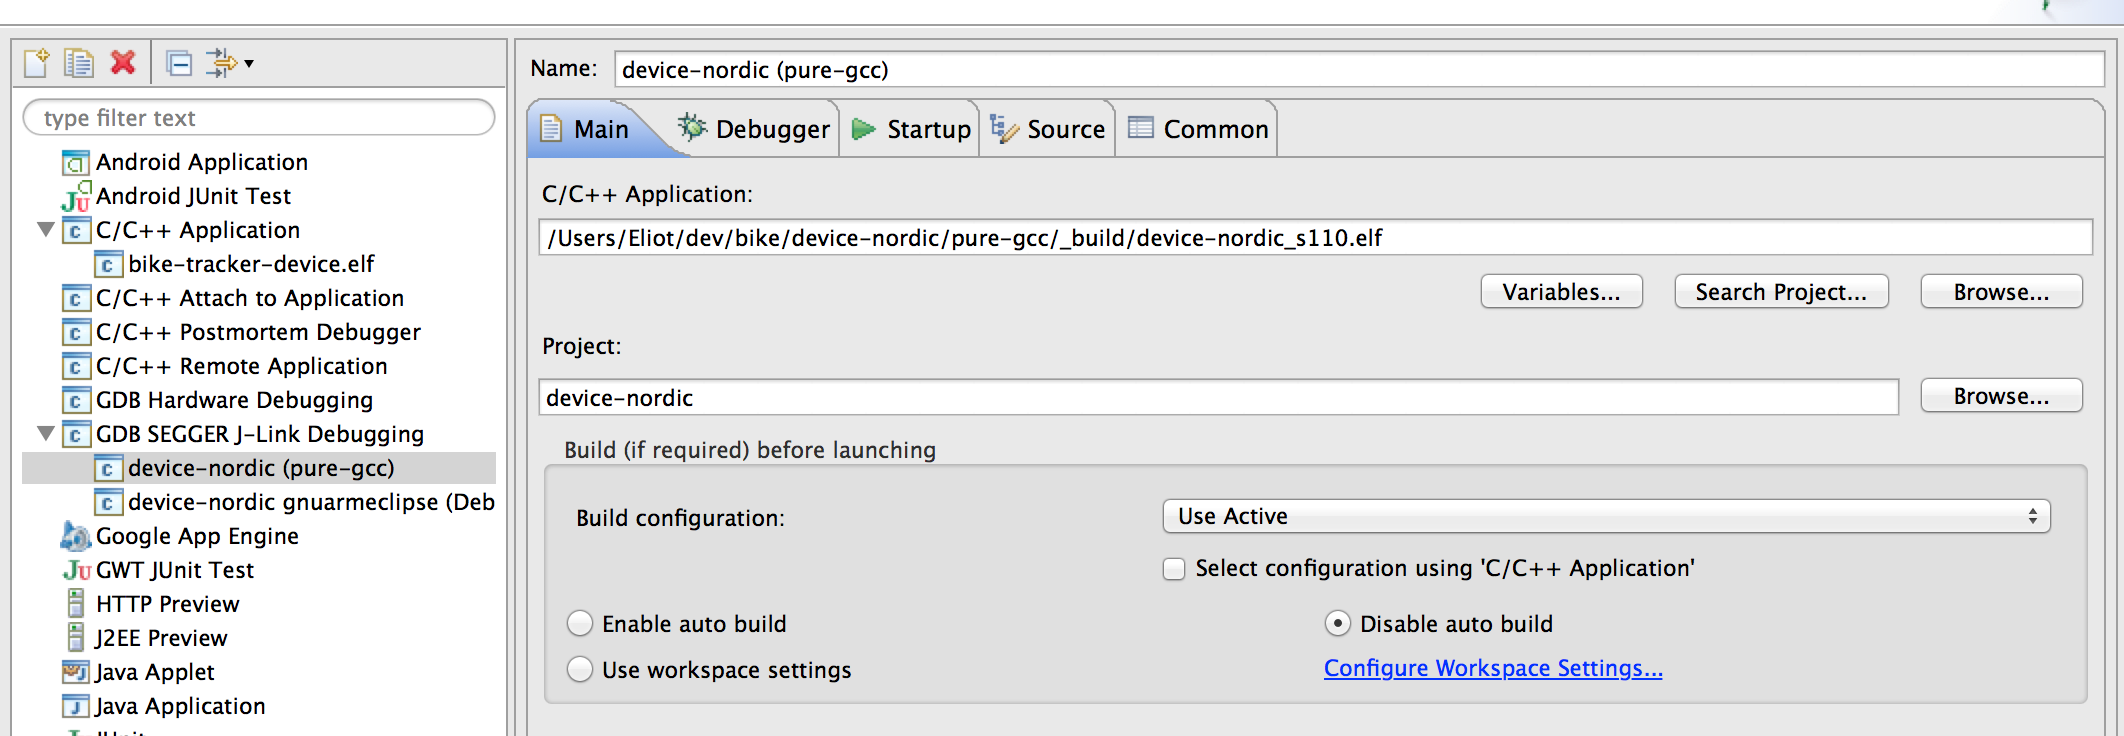
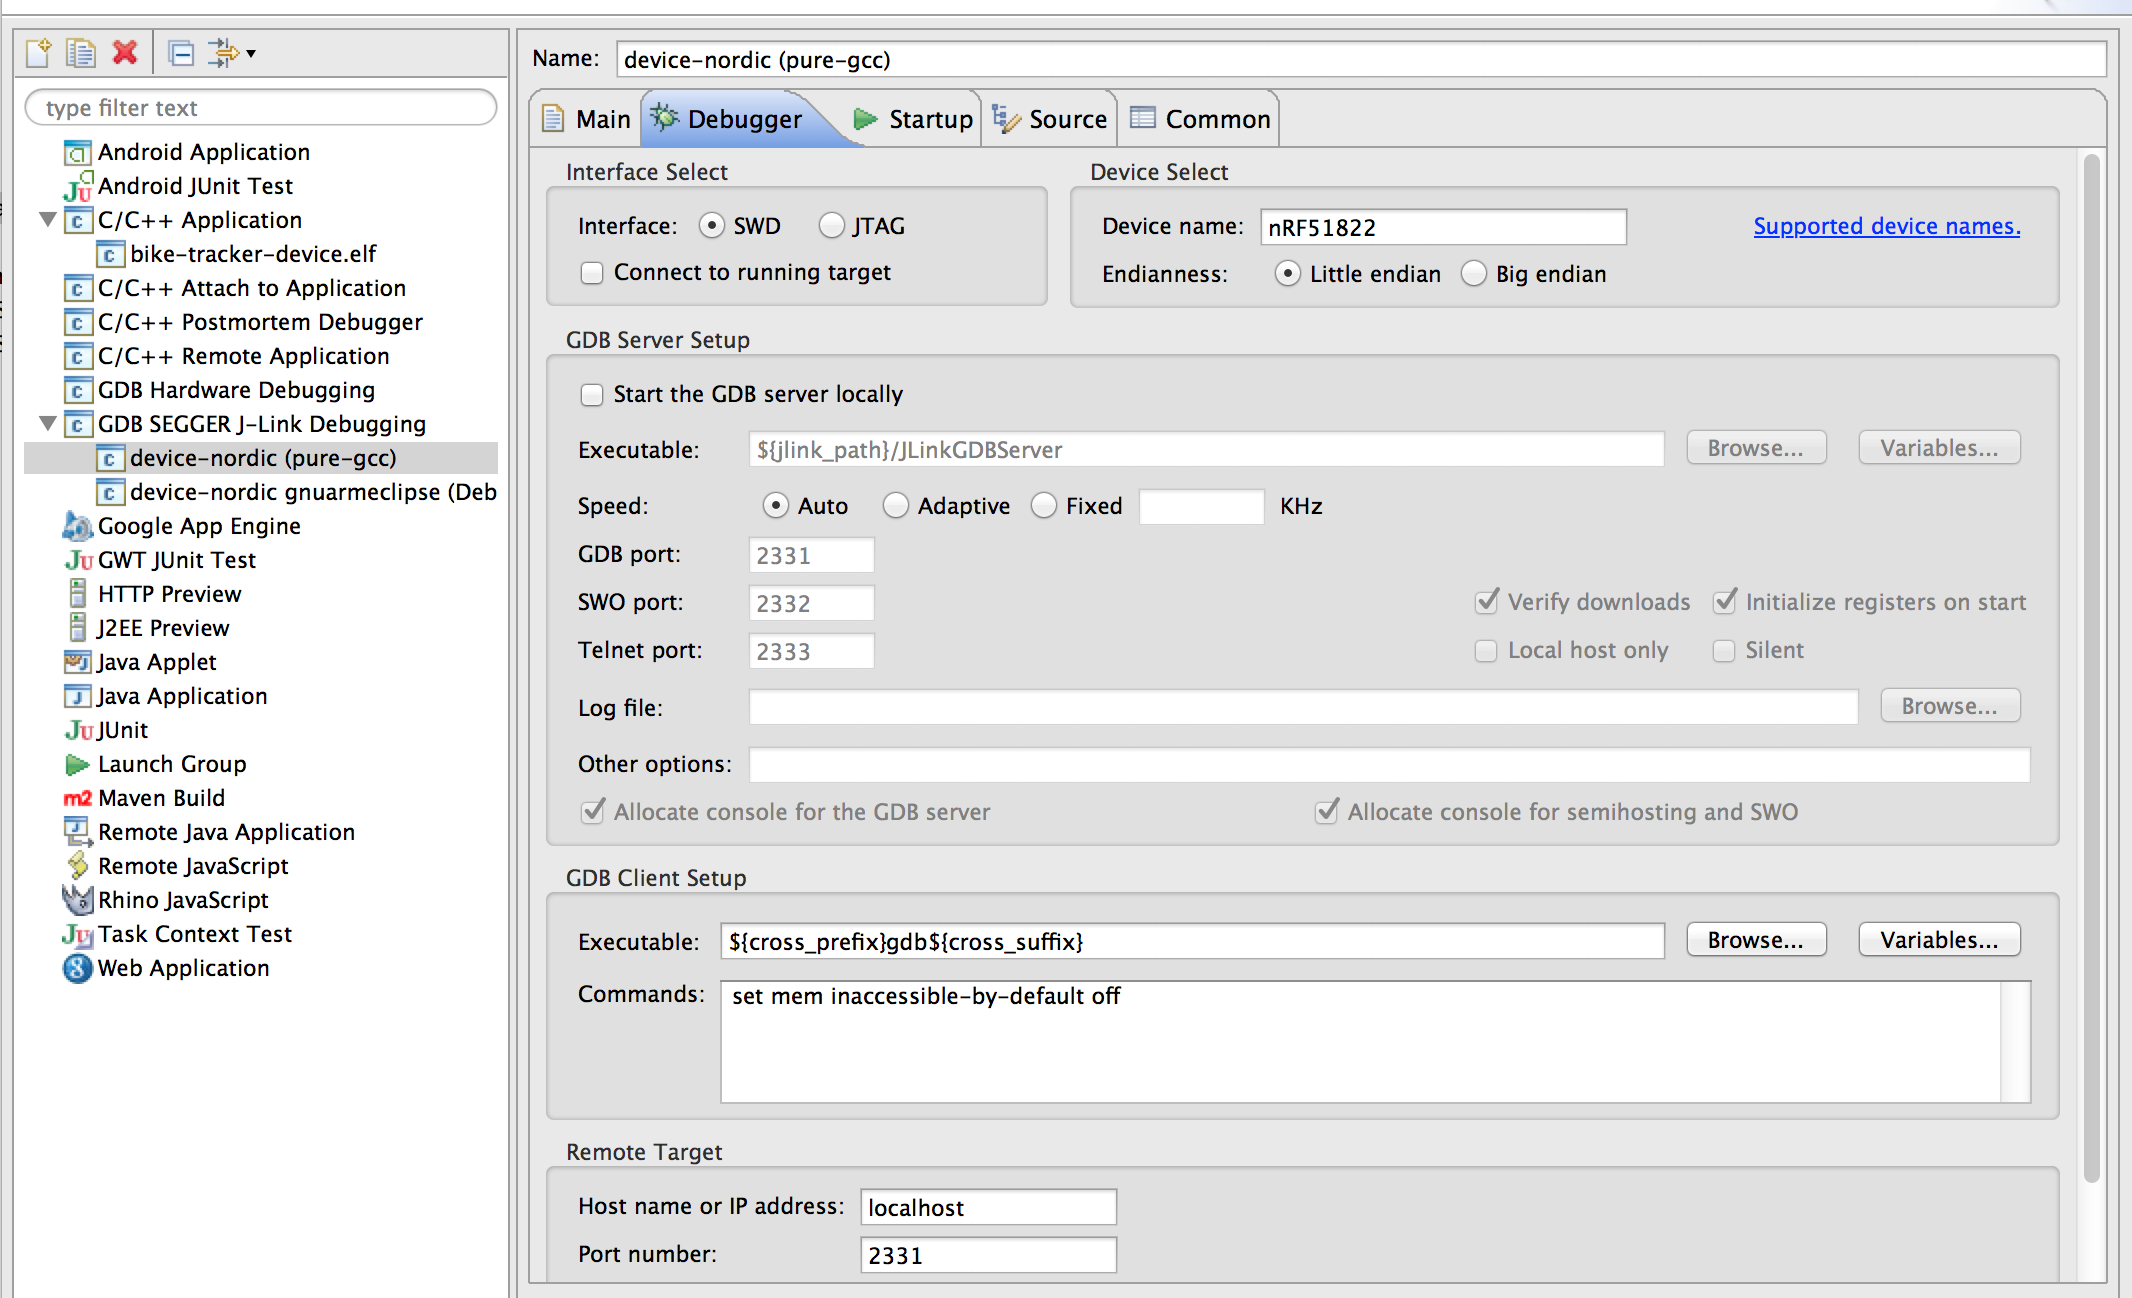
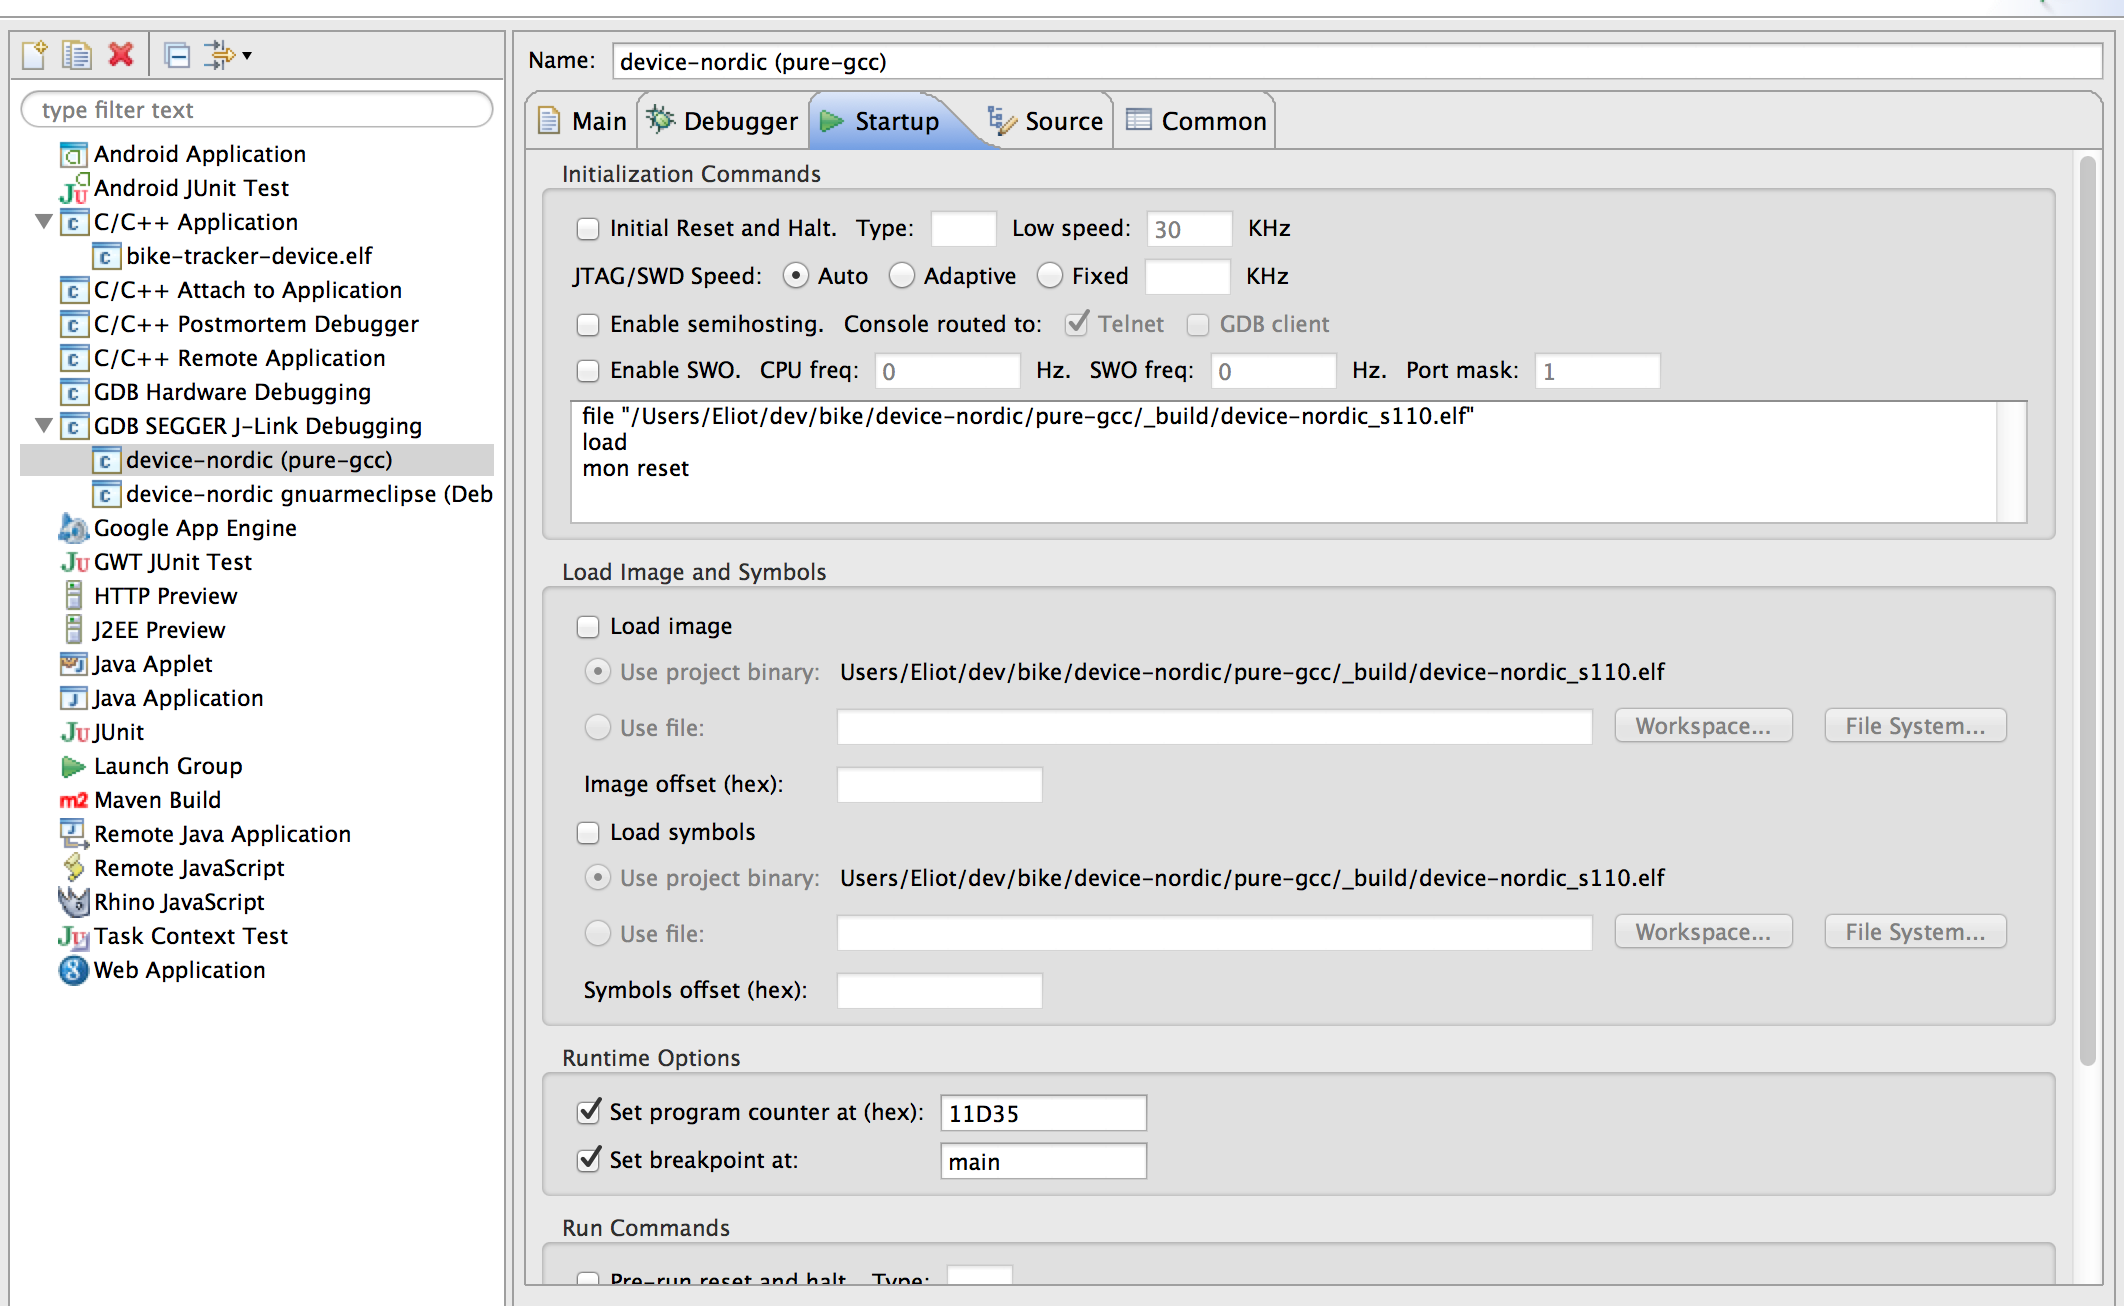
I have Eclipse CDT set up for debugging the ble_app_proximity sample code on a Mac. I can start the GDB server on the console and connect to it. Flashing the code seems to work. I've already flashed the softdevice from a Windows machine. Disconnecting GDB and powering up without debugging, I can connect to the device from the Master Control Panel on a Windows machine. So the device is working without debugging.

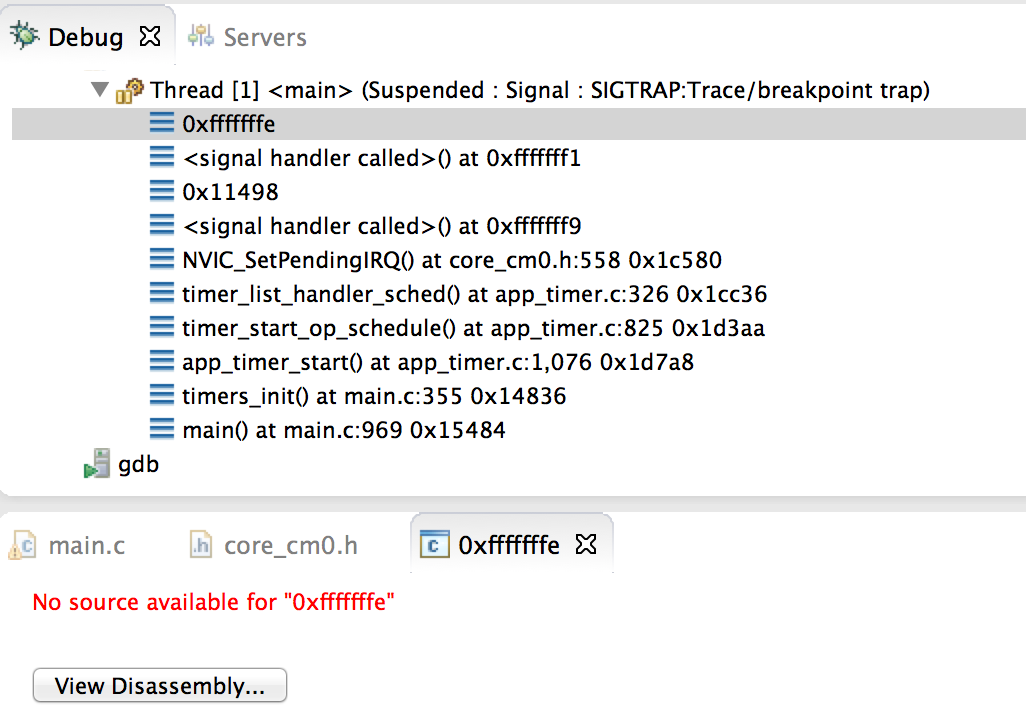
But when I try to debug from Eclipse, the debugger is stopping on every line within timers_init(). See thread screenshot attached. I would expect clicking the Resume (play) button to take me to my next breakpoint, or resume fully if I have no breakpoints. But no progress is made out of NVIC_SetPendingIRQ().

screenshot_nordic_gdb.png

  • I still can't get this to work.

    Following your suggestion here...

    devzone.nordicsemi.com/.../strange-behaviour-with-nrf51822-and-s110

    ... gdb gets very confused:

    monitor speed 30
    monitor flash device = nRF51822
    load
    Loading section .text, size 0xab90 lma 0x14000
    Loading section .ARM.exidx, size 0x8 lma 0x1eb90
    Loading section .data, size 0x94 lma 0x1eb98
    Start address 0x1e6e1, load size 44076
    Transfer rate: 21521 KB/sec, 8815 bytes/write.
    mon reset
    monitor flash download = 1
    The target endianness is set automatically (currently little endian)
    No symbol table is loaded.  Use the "file" command.
    No symbol table is loaded.  Use the "file" command.
    No symbol table is loaded.  Use the "file" command.
    
    monitor halt
    continue
    Continuing.
    
    Temporary breakpoint 1, 0x000157bc in main ()
    No breakpoint number 5.
    

    If I instead use "Load image" and "Load symbols" and point to the .elf file (I'm now using the GNU ARM Eclipse plugin, which seems to produce both an .elf file and a .hex file), then reduce my gdb startup commands to simply "mon reset", I get the same errors.

    If I then add the following back in for startup commands...

    mon speed 10000
    mon endian little
    mon flash download = 1
    mon flash device = NRF51822
    mon reset 0
    

    ... I do get the same errors on the gdb console, but at least some code executes on the device. The debugger doesn't show me the breakpoint in the code, it creates a "Source not found" window at an address in my main() (0x157bc).

    I've also followed your advice here...

    devzone.nordicsemi.com/.../uart-application-problem

    ...and put address 114CD in for "Set program counter at".

    And I've removed the default NVIC_SystemReset() call in the app_error_handler() and instead called ble_debug_assert_handler(), as you suggested somewhere.

    Am out of ideas.

  • As for the first part, you haven't included the first line in my suggestion, the file line. When you haven't, GDB will for sure be confused.

    Also, if you hardcode the reset handler, you must be certain that it is correct for your softdevice version. It seems to me that the reset handler for 6.0.0 is on 0x12B99, so if you then try to use 0x114CD, nothing will work correctly.

    If you struggle with Eclipse, you may be better off starting out with command line GDB, get that working, and only then move to Eclipse.

    Finally, you can ignore all the other monitor commands in the application note, as they are not strictly required.

  • I finally managed to get this to work using a combination of the unofficial pure gcc Makefiles here:

    github.com/.../nrf51-pure-gcc-setup

    and the GNU ARM Eclipse plugin here:

    gnuarmeclipse.livius.net/.../

    I'm using the pure-gcc Makefiles to build the project and start the Segger GDB server, but then the GDB client is all within Eclipse. Will attach screenshots of my configuration for the Eclipse GDB stuff in case it helps anyone else. Using the terminal version of the GDB client was useful in figuring out how it all works, but in the end I've switched back to the Eclipse GDB client for now.

    screenshot_debug_01.png

    screenshot_debug_02.png

    screenshot_debug_03.png

  • Hi Ellot,

     I am using the same Eclipse plugins from livius as you.  I don't use the makefile.  I created the Eclipse project using the Wizard for generic ARM.  Then go to project properties and change the processor to Cortex-M0 and set all the include paths.  Add links to SDK sources as require.  Debug using the default settings.  I have no problem debugging blank app.  When using s110, it just doesn't break.  To be able to debug with s110, the trick I found is to first upload the code using nRFGo via DFU upload via serial.  I have the DFU project in Eclipse working.  After DFU flash the App, go back to Eclipse and start debuting, it should stop at system startup.  One other thing, there is a limit of 4 break points.  Debug won't start properly if you set more than 4 break points.  I hope this helps.  Good luck.
    

    Hoan

  • hi, What eclipse/gcc toolchain version are you using? What Segger jlink module/firmware version are you using? What Segger jlink software version are you using?

    I have some very strange behavior using eclipse luna (latest version) and I am in the process to downgrade and use eclipse Kepler 4.3 SR2. According to GNU ARM Eclipse is the most stable option. They recommend to use gcc-arm-none-eabi-4_8-2014q2 (I am using this ver already). I am using the latest Segger version.

    My next step is use Kepler and if I do not see any change I will use the toolchain/jlink recommended/included in the SDK.

    Feel free to post your combinations and we may narrow down this issue.

Related