Strange Debugging Behavior on nrf9160 DK (unsure if hardware or software)

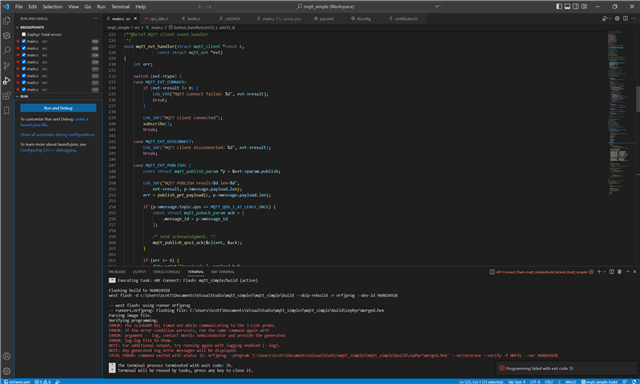
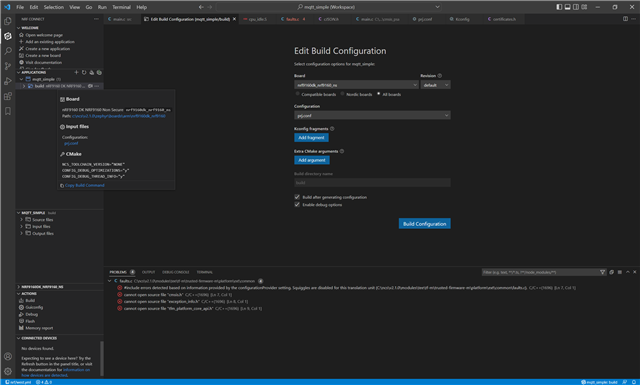
Visual Studio often refuses to run the debugger because the dev kit will disconnect suddenly during the flashing process. The same happens when I tried with Keil uVision before. When debugging does start in visual studio, I get strange debugging behavior such as inability to pause and skipped breakpoints. Please see screenshot for the debugger failing to start.

Parents
  • Hello,

    It could be an issue with the SEGGER driver. Can you try close all comports (e.g. close nRF Terminal and other other terminal window you may have open), and try again?

    Kenneth

  • I can't close nRF terminal but a can choose to hide it and not connect any DK COM ports. I can start the debugger but it still fails to stop at certain breakpoints and does stop at breakpoints that I haven't set. When it goes into a hardfault it will refuse to reset and run again unless I restart the debugger (see picture with circled "paused on exception"). It looks like Visual Studio cannot open certain source files, even though it builds and doesn't give any "not found" errors in the source code.

  • Hi,

    If you have problem setting breakpoint etc, do check what optimization you have set when building your project. Typically it's not a 1:1 relationship between a source file and assembly instructions when optimization is turned ON, this is because the compiler can optimize and also re-use code between different source files. To avoid this I recommend to build with Enable debug options, or just set the two config options that are mentioned:
    https://nrfconnect.github.io/vscode-nrf-connect/connect/debug_app.html 

    When you add a build configuration with this option checked, the following options are set:

    CONFIG_DEBUG_OPTIMIZATIONS - This option limits the optimizations made by the compiler to only those that do not impact debugging.

    CONFIG_DEBUG_THREAD_INFO - This option adds additional information to the thread object, so that the debugger can discover the threads. This will work for any debugger. Additional threads appear in the Call Stack View.

    Best regards,
    Kenneth

Reply
  • Hi,

    If you have problem setting breakpoint etc, do check what optimization you have set when building your project. Typically it's not a 1:1 relationship between a source file and assembly instructions when optimization is turned ON, this is because the compiler can optimize and also re-use code between different source files. To avoid this I recommend to build with Enable debug options, or just set the two config options that are mentioned:
    https://nrfconnect.github.io/vscode-nrf-connect/connect/debug_app.html 

    When you add a build configuration with this option checked, the following options are set:

    CONFIG_DEBUG_OPTIMIZATIONS - This option limits the optimizations made by the compiler to only those that do not impact debugging.

    CONFIG_DEBUG_THREAD_INFO - This option adds additional information to the thread object, so that the debugger can discover the threads. This will work for any debugger. Additional threads appear in the Call Stack View.

    Best regards,
    Kenneth

Children
Related