Stopped by vector catch when attempting to debug NRF52840 using modified Thread Example

Hello everyone!

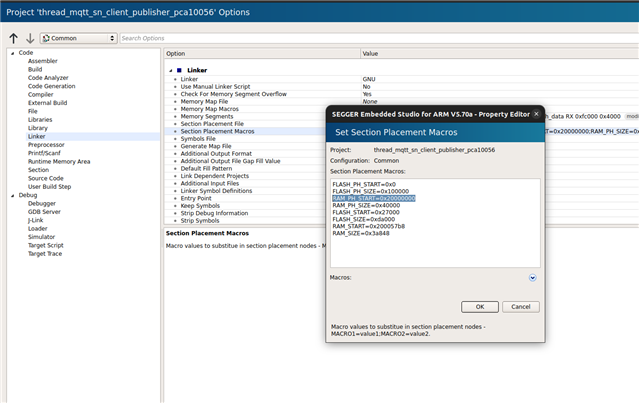
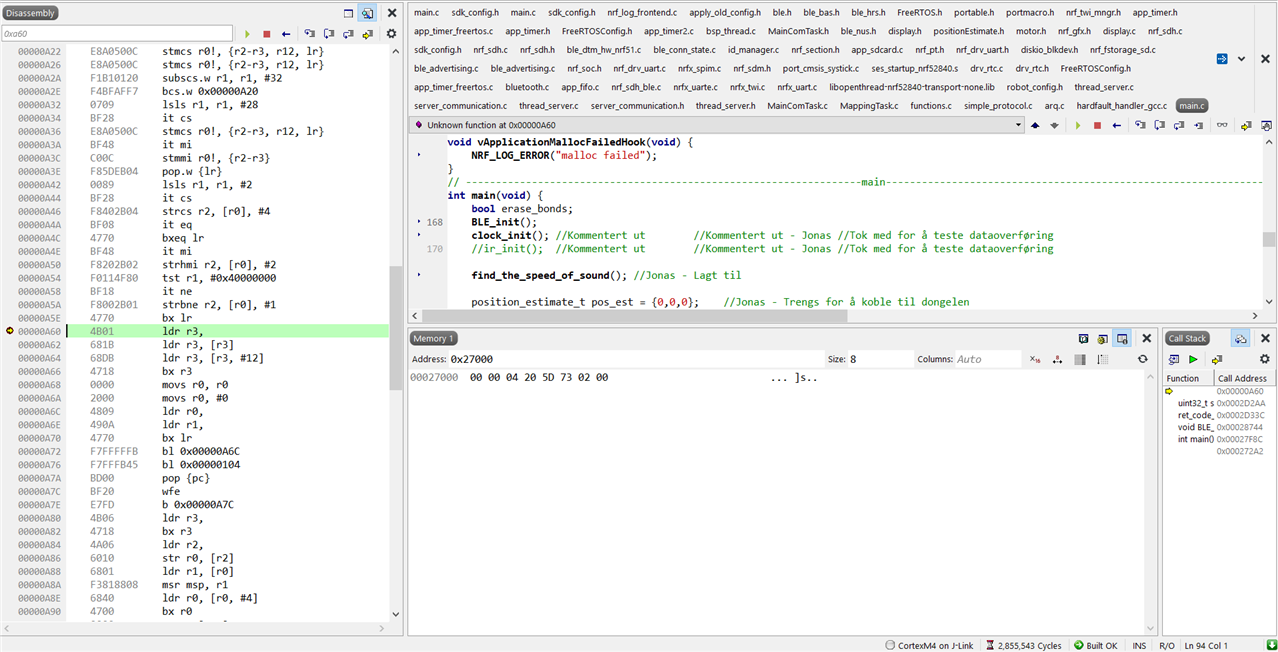
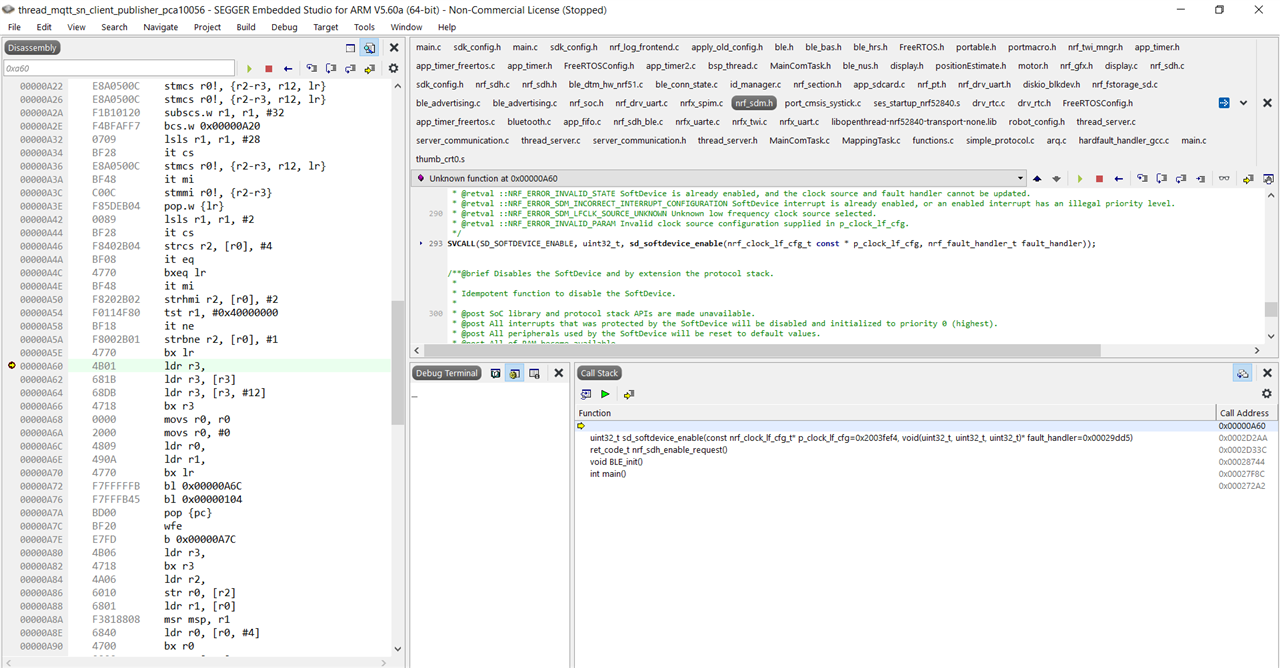
I have a Segger project written previously to catch and process sensordata from a NRF52840 DK thats connected to some peripherals (HC-SR04 and such). My current goal is to publish this data via MQTT/Thread to a border router. I have run the thread example and tested it on the DK, and it works fine. I have tried for quite some time now to include everything necessary to run my sensor project IN the thread example, and now if I switch out the main.c file in the Thread Example with the sensor project's one everything builds and compiles. However I am struggling to debug/run anything. I have tried augmenting the flash placement xml file and using different softdevice files, however I always get 'stopped by Vector Catch' when trying to debug. I have read that this could be due to the flash/ram allocation being incorrectly configured, however I have not been able to mend this based on similar issues. Could someone have a look and see if they could spot what causes this? I am open to other solutions for publishing via MQTT/Thread from an existing project if my method is sub-optimal. Thank you in advance.

OS: Windows 10, IDE: Segger Embedded Studio for ARM 5.60a, HW: NRF52840 DK 

Segger project file is in examples\thread\mqttsn_client_publisher\pca10056\blank\ses

7776.Thread Example.zip

Parents
  • Hello,

    Could you please re-upload the project as a .zip? I get a checksum error when I try to extract the .rar you uploaded for some reason.

    Best regards,

    Vidar

  • I was unable to reupload the .zip directly to the post, does Google Drive work?

    Below is a share link to where I've uploaded the augmented thread example as a .zip.

    (EDIT: it seems the file was uploaded to the post anyway, so either link should work the same)

    https://drive.google.com/file/d/1Re8y3IvUR5q2HL89PqwD_BpJmVwGwhLA/view?usp=share_link

  • Thanks. I was able to download your attachment from google drive now. Turns out the problem was related to incorrect linker settings, as you suspected. In your case, the RAM_PH_START symbol was configured with an offset from where the RAM memory region actually starts, which caused the initial stack pointer value to become invalid. 

    The fix is to set the RAM_PH_START symbol to 0x20000000 (Memory map) here:

  • This seems very logical, however I still receive the stopped by vector catch phrase in the debug terminal when running, and I have LED5 blinking whenever I attempt to read the NRF_LOG info with either RTT viewer or Segger, do you have any advice on how to remedy this?

  • Try to read out the initial stack pointer value @ 0x27000 to see what it's set to now. You can use the memory window in Segger for this. Alternatively, with nrfjprog:

    $ nrfjprog --memrd 0x27000

  • Here, I am not quite sure what to look at, this is after debugging and running.

    Let me know if there's anything else to try and find.

    Memory window in Segger

  • The stack pointer is correct now and the call stack shows that your program is reaching main().

    I can tell what function is causing the exception because the call stack view is cropped.

Reply
  • The stack pointer is correct now and the call stack shows that your program is reaching main().

    I can tell what function is causing the exception because the call stack view is cropped.

Children