VScode Debugger fails to launch with custom board

I think this is a bug report for the VScode plugin 

One of my boards shows this error when I try to debug
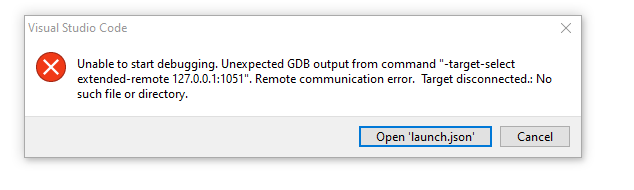
  • Nrf52833 custom board connected with SWD on Jlink
  • I was able to debug this board before.
  • I can still debug other boards.
  • I can debug this board with Segger embedded studio.
  • I can program it and I can attach RTT viewer

I suspect there's some stray/locked/missing files somewhere that are specific to this MCU but I have no idea where to look.

What command is used to launch the debugger? is there any way to get a log that might include the error?

Parents Reply Children
  • Thanks, I'd not seen that info before.

    but I don't understand, I have the same launch.json for all of my custom boards, but only 1 has stopped working. 

    It looks like this

    {
        // Use IntelliSense to learn about possible attributes.
        // Hover to view descriptions of existing attributes.
        // For more information, visit: https://go.microsoft.com/fwlink/?linkid=830387
        "version": "0.2.0",
        "configurations": [
        
            {
                "name": "Launch build",
                "type": "nrf-connect",
                "request": "launch",
                "config": "c:\\Vigglab\\Projects\\Doodoody\\BTSender_ClipPair\\NCS_Firmware\\ClipPair\\build",
                "runToEntryPoint": "main"
            }
        ]
    }

  • If there's no obvious answer to this then it's no problem. I just thought there might be an easy fix that I didn't know about.

    Thanks for your help

Related