unable to debug nrf52840 USB CDC ACM built on BLE client application

I'm facing an issue to debug nrf52840 using usb cdc acm application on top of ble client application . Same result when using Fanstel based on nrf52840 connected via usb to the host as well.

  1. In most cases resetting the target force a recovery after flashing the application. - Why the target needs recovery ?
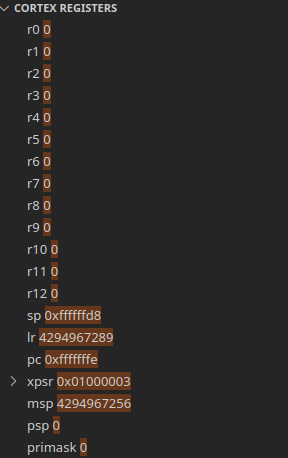
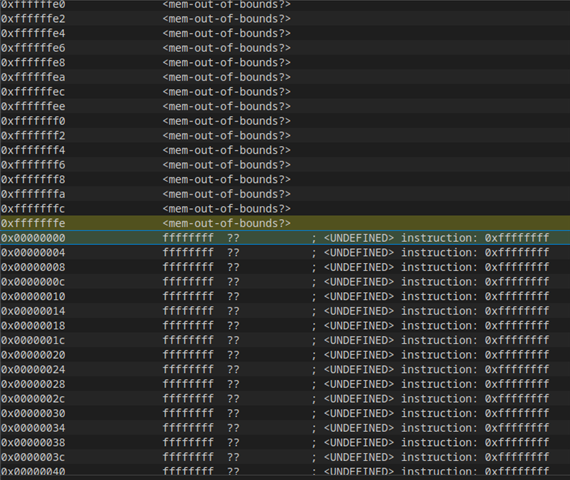
  2. When running the debugger it returns with exception, 

Core registers:
Disassembly viewer:
Using Cortex-Debug extension for vscode. launch.jason as follows:

{
    "version": "0.2.0",
    "configurations": [


        {
            "name": "Cortex Debug",
            "cwd": "${workspaceRoot}",
            "executable": "${workspaceRoot}/_build/nrf52840_xxaa.out",
            "request": "launch",
            "type": "cortex-debug",
            "servertype": "jlink",
            "device": "nrf52",
            "interface": "swd",
            "serialNumber": "",
            "armToolchainPath": "/usr/local/gcc-arm-none-eabi-6-2017-q2-update/bin",
            "svdFile": "${workspaceRoot}/modules/nrfx/mdk/nrf52840.svd",
        }
    ]
}

When I use BLE client application or USB CDC ACM application, the debugger runs without any problems


Please help !
Parents
  • Hi

    I think you have your answer there, the Access port protection (APPROTECT) is enabled in your application, and you have to disable it using the APPROTECT register (see nRF52840 PS here) to be able to read the flash after it has been flashed like this.

    Best regards,

    Simon

  • Hi,

    I already tried this option - disable the APPROTECT.

    Inside my main I wrote flash by

    volatile uint32_t user_data  __attribute__ ((section(".uicr_customer"))) = (uint32_t)(0xFFFFFF5A);

    inside of ble_app_uart_c_gcc_nrf52.ld

    1. I defined the memory section

    MEMORY

    {
      UICR (rw) : ORIGIN = 0x10001208, LENGTH = 0x4
      FLASH (rx) : ORIGIN = 0x26000, LENGTH = 0xda000
      RAM (rwx) :  ORIGIN = 0x2000C5B0, LENGTH = 0x33A50

    }

    2. and added this section of the end of the file

    SECTIONS

    {
      .uicr_customer : 
      {
        KEEP(*(.uicr_customer))
      } > UICR
    }

    For a long period it didn't worked out for me, but because you pointed me out back to this solution, I found out a scenario where I was able to activate the debugger. but couldn't open the usb port while the debugging session was active

    Scenario as follows:

    (This time I used JFlash app instead of using nrfjprog commands)

    • erase chip
    • program & verify
    • Without start running the application.. go to vscode, pushed debug
    • The debugger started and stopped at main as expected
    • Jflash read memory was ok, UICR value OK (see green mark)
    • Continued to run the application in debug mode
    • Failed to open the USB port !
    • Pulled out and pushed back in the USB
    • Run the debugger again - and it failed (same behavior as in the first question)!
    • read flash failed - see red marking at address 0x00000000 
      • despite of that UICR value remained 0xFFFFFF5A 


    summarize the issues:

    1. USB connection could not be established while the debugger is running

    2. Re-Attaching the USB connection blocks somehow the application from running , and blocks the flash read. 

    please advise


Reply
  • Hi,

    I already tried this option - disable the APPROTECT.

    Inside my main I wrote flash by

    volatile uint32_t user_data  __attribute__ ((section(".uicr_customer"))) = (uint32_t)(0xFFFFFF5A);

    inside of ble_app_uart_c_gcc_nrf52.ld

    1. I defined the memory section

    MEMORY

    {
      UICR (rw) : ORIGIN = 0x10001208, LENGTH = 0x4
      FLASH (rx) : ORIGIN = 0x26000, LENGTH = 0xda000
      RAM (rwx) :  ORIGIN = 0x2000C5B0, LENGTH = 0x33A50

    }

    2. and added this section of the end of the file

    SECTIONS

    {
      .uicr_customer : 
      {
        KEEP(*(.uicr_customer))
      } > UICR
    }

    For a long period it didn't worked out for me, but because you pointed me out back to this solution, I found out a scenario where I was able to activate the debugger. but couldn't open the usb port while the debugging session was active

    Scenario as follows:

    (This time I used JFlash app instead of using nrfjprog commands)

    • erase chip
    • program & verify
    • Without start running the application.. go to vscode, pushed debug
    • The debugger started and stopped at main as expected
    • Jflash read memory was ok, UICR value OK (see green mark)
    • Continued to run the application in debug mode
    • Failed to open the USB port !
    • Pulled out and pushed back in the USB
    • Run the debugger again - and it failed (same behavior as in the first question)!
    • read flash failed - see red marking at address 0x00000000 
      • despite of that UICR value remained 0xFFFFFF5A 


    summarize the issues:

    1. USB connection could not be established while the debugger is running

    2. Re-Attaching the USB connection blocks somehow the application from running , and blocks the flash read. 

    please advise


Children
No Data
Related