I'm facing an issue to debug nrf52840 using usb cdc acm application on top of ble client application . Same result when using Fanstel based on nrf52840 connected via usb to the host as well.
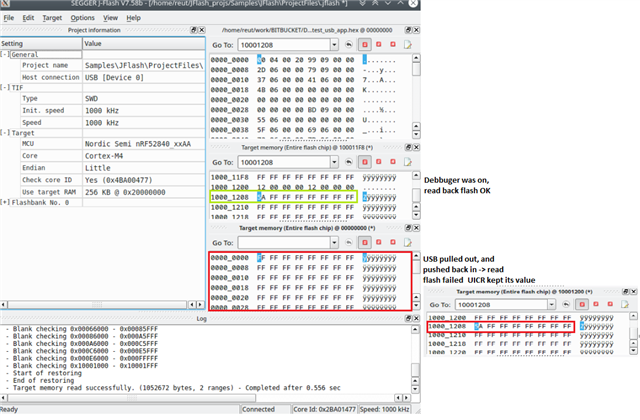
- In most cases resetting the target force a recovery after flashing the application. - Why the target needs recovery ?
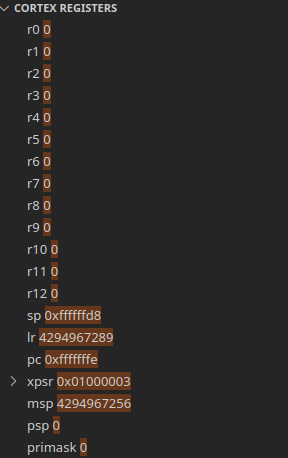
- When running the debugger it returns with exception,
Core registers:
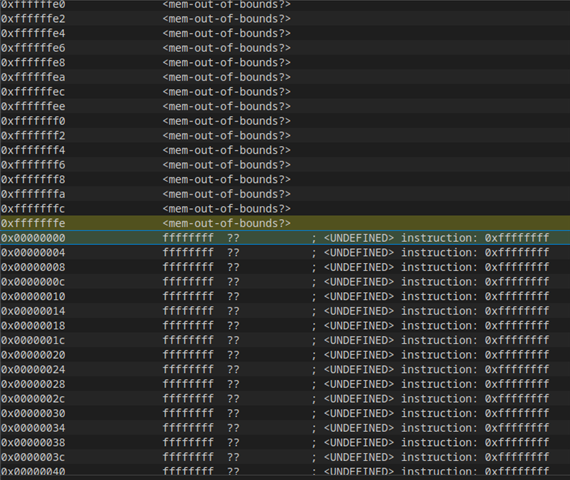
Disassembly viewer:
Using Cortex-Debug extension for vscode. launch.jason as follows:
{
    "version": "0.2.0",
    "configurations": [


        {
            "name": "Cortex Debug",
            "cwd": "${workspaceRoot}",
            "executable": "${workspaceRoot}/_build/nrf52840_xxaa.out",
            "request": "launch",
            "type": "cortex-debug",
            "servertype": "jlink",
            "device": "nrf52",
            "interface": "swd",
            "serialNumber": "",
            "armToolchainPath": "/usr/local/gcc-arm-none-eabi-6-2017-q2-update/bin",
            "svdFile": "${workspaceRoot}/modules/nrfx/mdk/nrf52840.svd",
        }
    ]
}

When I use BLE client application or USB CDC ACM application, the debugger runs without any problems


Please help !