Hello,
We are developing a library which is intended to use the trustzone feature (TF-M based) available with nrf5340 DK. We want to debug the custom secure service API running in TF-M application RoT service.
We used the sample tfm_secure_peripheral and we couldn't see any SPE prints from VCOM0(COM6) and we could see the NSPE prints from VCOM1(COM5). I attached the logs which is captured in NSPE.
Connected via Serial Port with settings COM5 115200 8n1 rtscts:off

*** Booting Zephyr OS build v3.2.99-ncs1 ***
SPP: sending message: Success
SPP: processing signals: Success
SPP: processing signals: Success
SPP: sending message: Success
SPP: processing signals: Success
SPP: processing signals: Success
SPP: sending message: Success
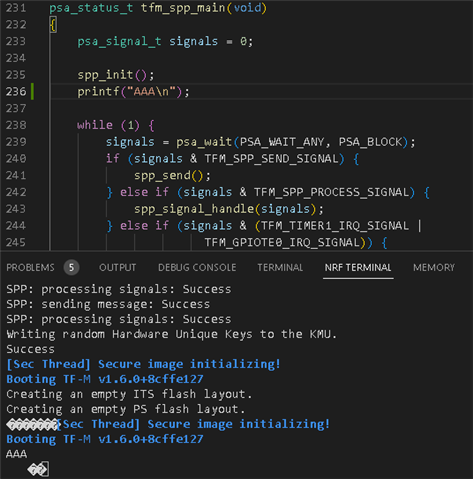
Further, we found one blog from debugging-tf-m-with-nrf5340-dk-2-0-0 that looks like same what we are facing. As per this blog, we enabled and changed the below configuration. After that, we could see some SPE prints from VCOM1(COM5) but we could not see any prints from secure peripheral samples(secure_peripheral_partition.c). Please refer the below logs.
Changed configuration to get SPE prints:
CONFIG_TFM_UART1_TXD_PIN=20
CONFIG_TFM_UART1_RXD_PIN=22
CONFIG_TFM_EXCEPTION_INFO_DUMP=y
CONFIG_TFM_SPM_LOG_LEVEL_DEBUG=y
Writing random Hardware Unique Keys to the KMU.
Success
[Sec Thread] Secure image initializing!
TF-M isolation level is: 0x00000001
Booting TF-M v1.6.0+8cffe127
Creating an empty ITS flash layout.
Creating an empty PS flash layout.
Used version:
1. nrf connect SDK: v2.2.0
2. nrf5340-DK board: 2.0.0
Could you please point to any documentation or configuration which could help to get the SPE prints from custom TF-M application RoT service?