J-Link Base not showing anything and debug not working VS Code

Hi,

I am currently developing a software for a custom board with nRF9160 chip.

The code is tested and works on nrf9160DK. The debugging works and the device is showing all information from logs.

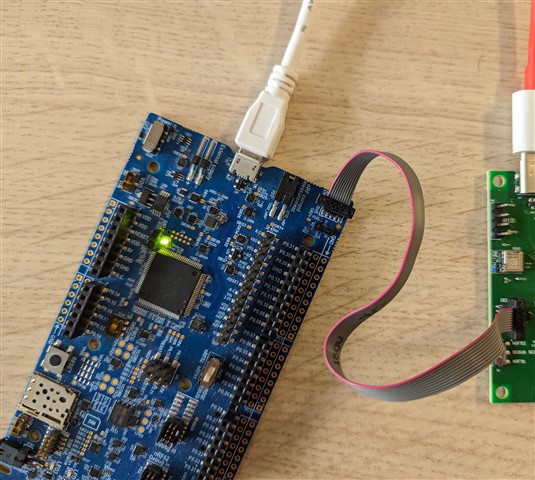
The problem comes when I move to my custom board and I try to upload code from my J-Link Base.

There the code uploads but you cannot see any log information on the port of the J-Link.

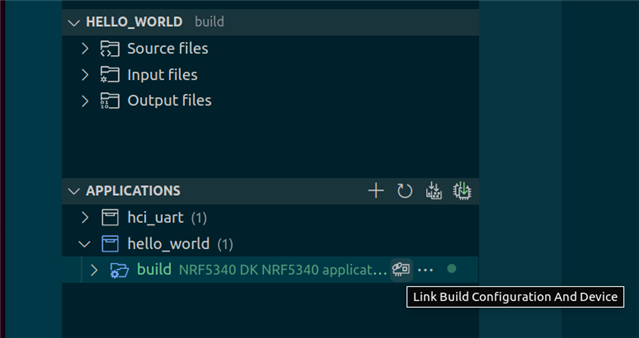
Also when I try to debug the code I get the following message:

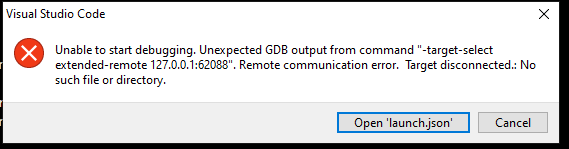
and I cannot seem to fix it.

For trying to see the log I go to NRF Terminal, select the COM port that the device is on and choose 115200 8n1.

Also tried with putty with 9600 but still the connection is established but nothing comes on the screen,

Any suggestions on why the J-Link is not functioning as intended?

Parents Reply Children
  • Yes, here is the picture of the connection between the two devices.

  • The red wire on the cable indicates pin 1, and it is connected correctly on the nRF9160 dk. Have you tried turning it 180 degrees on your custom board to see if this could be the issue?


    Also, could you verify that the IO voltage is indeed 1.8V on your external board, by measuring pin 1 on the 10-pin SWD connector (on your custom board)?


    Kind regards,

    Håkon

  • The cable cannot be flipped because of the connector. But I am sure this is correct because the connector is shared between nRD91 and nRF52 on the custom board and for nRF52 there is no problem debugging and uploading code. for the nRF91 only uploading is possible.

    I just measured the pin and it is giving 1.8V.

  • Hi,


    Could you try to connect with J-Link Commander?


    To connect there, you can issue:

    device nrf9160_xxaa
    si 1
    speed 500
    connect


    And please share the output.


    Kind regards,

    Håkon

  • This is the output:

    Device "NRF9160_XXAA" selected.
    
    
    Connecting to target via SWD
    ConfigTargetSettings() start
    ---Setting ROM table---
    ConfigTargetSettings() end
    Found SW-DP with ID 0x6BA02477
    DPIDR: 0x6BA02477
    CoreSight SoC-400 or earlier
    Scanning AP map to find all available APs
    AP[7]: Stopped AP scan as end of AP map has been reached
    AP[0]: AHB-AP (IDR: 0x84770001)
    AP[1]: AHB-AP (IDR: 0x24770011)
    AP[2]: JTAG-AP (IDR: 0x12880000)
    AP[3]: APB-AP (IDR: 0x54770002)
    AP[4]: JTAG-AP (IDR: 0x12880000)
    AP[5]: JTAG-AP (IDR: 0x12880000)
    AP[6]: MEM-AP (IDR: 0x128800A1)
    Iterating through AP map to find AHB-AP to use
    AP[0]: Core found
    AP[0]: AHB-AP ROM base: 0xE00FF000
    CPUID register: 0x410FD212. Implementer code: 0x41 (ARM)
    Feature set: Mainline
    Found Cortex-M33 r0p2, Little endian.
    FPUnit: 8 code (BP) slots and 0 literal slots
    Security extension: implemented
    Secure debug: enabled
    CoreSight components:
    ROMTbl[0] @ E00FF000
    [0][0]: E000E000 CID B105900D PID 000BBD21 DEVARCH 47702A04 DEVTYPE 00 Cortex-M33
    [0][1]: E0001000 CID B105900D PID 000BBD21 DEVARCH 47701A02 DEVTYPE 00 DWT
    [0][2]: E0002000 CID B105900D PID 000BBD21 DEVARCH 47701A03 DEVTYPE 00 FPB
    [0][3]: E0000000 CID B105900D PID 000BBD21 DEVARCH 47701A01 DEVTYPE 43 ITM
    [0][5]: E0041000 CID B105900D PID 002BBD21 DEVARCH 47724A13 DEVTYPE 13 ETM
    [0][6]: E0042000 CID B105900D PID 000BBD21 DEVARCH 47701A14 DEVTYPE 14 CSS600-CTI
    Cortex-M33 identified.

Related