
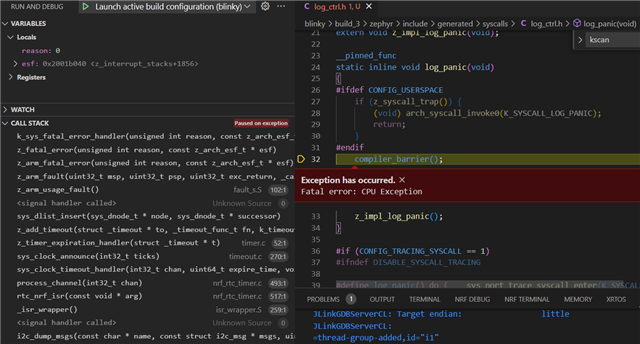
Application is communicating with a touch controller (FT5336) over I2C and registering a callback with kscan_config() and kscan_enable_callback(). Every few minutes a "ZEPHYR FATAL ERROR 0: CPU exception on CPU 0" (Fault during interrupt handling) occurs, restarting the application. Using debug I can see two "<signal handler called>" (photo'd) and I always see a call to "i2c_dump_msgs()" as the lowest call.
J-Link output:
[00:01:00.193,847] <err> os: ***** MPU FAULT *****
[00:01:00.193,878] <err> os: Data Access Violation
[00:01:00.193,878] <err> os: MMFAR Address: 0x4
[00:01:00.193,908] <err> os: r0/a1: 0x20006740 r1/a2: 0x00000000 r2/a3: 0x20000984
[00:01:00.193,908] <err> os: r3/a4: 0x00000000 r12/ip: 0x00000000 r14/lr: 0x00038ed9
[00:01:00.193,939] <err> os: xpsr: 0x21000221
[00:01:00.193,939] <err> os: Faulting instruction address (r15/pc): 0x00038d4e
[00:01:00.193,969] <err> os: >>> ZEPHYR FATAL ERROR 0: CPU exception on CPU 0
[00:01:00.193,969] <err> os: Fault during interrupt handling

[00:01:00.194,000] <err> os: Current thread: 0x200066a8 (unknown)
[00:01:00.465,148] <err> fatal_error: Resetting system
*** Booting Zephyr OS build v3.1.99-ncs1 ***
Debug:
Device tree:
&i2c1 {
	compatible = "nordic,nrf-twim";
	status = "okay";
	clock-frequency = <I2C_BITRATE_FAST>;
	pinctrl-0 = <&i2c1_default>;
	pinctrl-1 = <&i2c1_sleep>;
	pinctrl-names = "default", "sleep";

	touch_controller: ft5336@38 {
		compatible = "focaltech,ft5336";
		reg = <0x38>;
		label = "FT5336";
		int-gpios = <&gpio1 11 GPIO_ACTIVE_HIGH>; // YD
	};
};
I'm suspicious of the issue being related to my kscan callback because:
- It is the only interrupt off of I2C
- Commenting out registration of the callback avoids the error
I've read similar posts that say this issue arises when an interrupt interrupts an interrupt - Am I understanding that correctly? If so, shouldn't interrupt priorities avoid this? Where/how is this managed? Also worth noting this application uses bluetooth soft device, timers (rtc2), uart, pwm, etc.
Other info:
Zephyr: 3.1.99-ncs1
nRF Connect SDK: 2.1.0
nRF Connect for Desktop: 3.12.0
Development Platform: Windows
Board: Custom
Edit:
Not sure if it's related by occasionally see "<err> i2c_nrfx_twim: Error on I2C line occurred for message 0" in my application at roughly the same frequency, although I do not see this at the same time as the CPU fault.

