On nRF5340dk, unable to debug the peripheral_uart example multiple times successively

On my dev system:

  • MacOS (Monterey 12.6)
  • Visual Studio Code v1.76.2
  • nRF Connect SDK and toolchain v2.3.0

From a fresh start on my computer, plugged into my nRF5340dk, I can launch VS Code and debug the stock peripheral_uart example.  However, if I halt that example and attempt to debug it again, the system attempts to flash the example, makes considerable progress in the flashing process, then halts with this error:

[ #################### ]  12.132s | Erase file - Done erasing                                                          
[ #################### ]   1.239s | Program file - Done programming                                                    
[ #################### ]   1.259s | Verify file - Done verifying                                                       
[ #################### ]   5.708s | Erase file - Done erasing                                                          
[error] [SeggerBackend] - JLinkARM.dll reported "-1", "An unknown error.".                                             
[error] [SeggerBackend] - JLinkARM.dll reported "-1", "An unknown error.".
[error] [SeggerBackend] - JLinkARM.dll reported "-1", "An unknown error.".
[error] [SeggerBackend] - JLinkARM.dll reported "-1", "An unknown error.".
[error] [SeggerBackend] - JLinkARM.dll reported "-1", "An unknown error.".
[error] [  nRF53] - The write access failed, but no cause could be determined.
[error] [  nRF53] - It may be due to an unaligned access, accessing a nonexistent memory, or a communication issue.
[error] [  nRF53] - Failed writing to code!
[error] [  nRF53] - Failed to program flash
[error] [  nRF53] - Failed while programming file /Users/craigbroadbooks/Dev/Baxter/picard/nRF5340-firmware/peripheral_uart/build/zephyr/GENERATED_CP_APPLICATION_merged_domains.hex.
ERROR: JLinkARM DLL reported an error. Try again. If error condition
ERROR: persists, run the same command again with argument --log, contact Nordic
ERROR: Semiconductor and provide the generated log.log file to them.
NOTE: For additional output, try running again with logging enabled (--log).
NOTE: Any generated log error messages will be displayed.
FATAL ERROR: command exited with status 33: nrfjprog --program /Users/craigbroadbooks/Dev/Baxter/picard/nRF5340-firmware/peripheral_uart/build/zephyr/GENERATED_CP_APPLICATION_merged_domains.hex --sectorerase --verify -f NRF53 --snr 1050040129 --coprocessor CP_APPLICATION

Once in this state, I have found two ways to again debug the peripheral_uart example.  This first is to perform the "Recover Board" option for the device.  This doesn't always work.  The second option is to reset the device, then debug another example(blinky, peripheral_hr, or similar).  Once the other example loads, I can halt it and then debug the peripheral_uart example just fine.  So far these are the only solutions I've found.

Please note that I can debug other examples over and over without any issues.  This error scenario only seems to happen with the peripheral_uart example.

Is there a way to debug the peripheral_uart example successively without resorting to these workarounds?  This is quite important because the firmware I'm developing is based on the peripheral_uart template, so I/we will be affected by this issue indefinitely.

Please let me know if I need to clarify anything and provide additional information.

Thanks,

Craig

Parents
  • Hi Craig,

    I am not able to reproduce this just by debugging, but I see a similar behavior if I have an RTT viewer active, and then try to debug. RTT is used for logging with the peripheral_uart sample, so perhaps that is also what you are seeing? RTT is via the debugger, and unfortunately it is a common problem that programming is problematic while an RTT session is active.

    If you are not using RTT while this happens, then we need to look more into this. If so, can you elaborate in a bit more detail how you build and test. For instance, which board are you building for (typically nrf5340dk_nrf5340_cpuapp or nrf5340dk_nrf5340_cpuapp_ns)? Do you also see this is if you just try to re-flash, or only when the flashing happens as part of starting a debug session?

  • Hi Einar,

    Thanks for your prompt response.  I have some new data points that may help.

    • First of all, I neglected to mention that my MacBook has an M1 chip.  
    • Please note that I am new to the Nordic development and the toolchain.  I'm very experienced on other platforms FWIW.
    • I am not running an RTT viewer that I'm aware of.
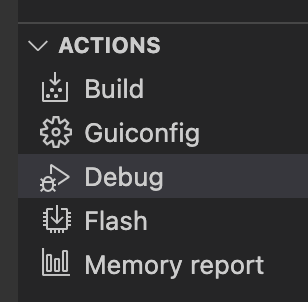
    • I am doing all my actions from the nRF Connect tab on the Activity bar: 

    Based on your question about what board specifically I was using, the answer is that I've been using the nrf5340dk_nrf5340_cpuapp_ns.  Since you inquired, I thought I should try the nrf5340dk_nrf5340_cpuapp to see if I got different results and I am pleased to tell you that the nrf5340dk_nrf5340_cpuapp works well and I am able to debug over and over with no issues.  That is good news for me because I could simply use that going forward.  

    I did some more testing with the nrf5340dk_nrf5340_cpuapp_ns.  I found that I am able to flash the device successively without issue, so it looks like the Debug action is where the problem is.

    Hopefully this helps.

    I also have an Intel based iMac.  If I have some time over the weekend, I will install everything and see if this issue happens on it.

    Craig

  • Hi Craig,

    I see the same on my end now, testing with nrf5340dk_nrf5340_cpuapp_ns (also with a Intel Linux machine). The error makes me think there may be an issue with access port protection, but checking the APPROTECT registers on the app and net core with nrfjprog that is not enabled in the UICR:

    $ nrfjprog --coprocessor CP_NETWORK --memrd 0x01FF8000
    0x01FF8000: 50FA50FA                              |.P.P|
    $ nrfjprog --memrd 0x00FF8000
    0x00FF8000: 50FA50FA                              |.P.P|
    

    And as I am able to read out memory content AP protect is clearly not enabled, so something else is causing problems. I see there have been a few similar reports before which has not been resolved.

    I will look further into this and get back to you.

  • Hi Craig,

    I do not have a solution for this yet unfortunately, but I have forwarded it to our tools team.

Reply Children
No Data
Related