New nRF52840 Target flashes but does not run and cannot be debugged

I have (what was originally a blank) nRF52840 installed in a new target board using a 6-pin SWD interface. Based on my research, such a configuration does not require a bootloader. I am able to flash code to the device and verify it, so I assume the connections are correct. I have flashed both the S140 soft device (v7.3.0) onto the nRF52840 as well as an application I have developed for the nRF52840DK, but the processor shows no signs of life. When I attempt to use the debugger I get the following from the debug console:

JLinkGDBServerCL: SEGGER J-Link GDB Server V7.80c Command Line Version
JLinkGDBServerCL:
JLinkGDBServerCL: JLinkARM.dll V7.80c (DLL compiled Sep 27 2022 16:06:20)
JLinkGDBServerCL:
JLinkGDBServerCL: -----GDB Server start settings-----
JLinkGDBServerCL: GDBInit file: none
JLinkGDBServerCL: GDB Server Listening port: 50427
JLinkGDBServerCL: SWO raw output listening port: 2332
JLinkGDBServerCL: Terminal I/O port: 2333
JLinkGDBServerCL: Accept remote connection: localhost only
JLinkGDBServerCL: Generate logfile: off
JLinkGDBServerCL: Verify download: off
JLinkGDBServerCL: Init regs on start: off
JLinkGDBServerCL: Silent mode: on
JLinkGDBServerCL: Single run mode: on
JLinkGDBServerCL: Target connection timeout: 0 ms
JLinkGDBServerCL: ------J-Link related settings------
JLinkGDBServerCL: J-Link Host interface: USB
JLinkGDBServerCL: J-Link script: none
JLinkGDBServerCL: J-Link settings file: none
JLinkGDBServerCL: ------Target related settings------
JLinkGDBServerCL: Target device: nRF52840_xxAA
JLinkGDBServerCL: Target device parameters: none
JLinkGDBServerCL: Target interface: SWD
JLinkGDBServerCL: Target interface speed: 12000kHz
JLinkGDBServerCL: Target endian: little
JLinkGDBServerCL:
=thread-group-added,id="i1" =cmd-param-changed,param="pagination",value="off" memset (buf=0x20000d58, c=c@entry=0, n=23136) at C:/ncs/v2.1.2/zephyr/lib/libc/minimal/source/string/string.c:381
381            n -= sizeof(mem_word_t);
[New Remote target]
Thread 2 received signal SIGTRAP, Trace/breakpoint trap.
0xdeadbeee in ?? ()
Examining the registers as suggested by the error message, I get:
Execute debugger commands using "-exec <command>", for example "-exec info registers" will list registers in use (when GDB is the debugger)
-exec info registers

r0 0xdeadbeef 3735928559
r1 0xdeadbeef 3735928559
r2 0xdeadbeef 3735928559
r3 0xdeadbeef 3735928559
r4 0xdeadbeef 3735928559
r5 0xdeadbeef 3735928559
r6 0xdeadbeef 3735928559
r7 0xdeadbeef 3735928559
r8 0xdeadbeef 3735928559
r9 0xdeadbeef 3735928559
r10 0xdeadbeef 3735928559
r11 0xdeadbeef 3735928559
r12 0xdeadbeef 3735928559
sp 0xdeadbeef 0xdeadbeef
lr 0xdeadbeef 3735928559
pc 0xdeadbeef 0xdeadbeef
xpsr 0xdeadbeef 3735928559
msp 0xdeadbeef 3735928559
psp 0xdeadbeef 3735928559
primask 0x0 0
basepri 0x0 0
faultmask 0x0 0
control 0x0 0
fpscr 0xdeadbeef 3735928559

One more curious thing that may help us get to the bottom of this is that when I use J-Link RTT Viewer (the app is supposed to use RTT), I sometimes get the error message:

ERROR: Could not find core in Coresight setup

All other times I get a message that CTRL-AP indicates that the device is secured:

I am then invited to unsecure the device which should erase all the flash, but no erase occurs and the connection claims to be successful:

LOG: Connecting to J-Link via USB...
LOG: Device "NRF52840_XXAA" selected.
LOG: InitTarget() start
LOG: Device will be unsecured now.
LOG: InitTarget() end
LOG: Found SW-DP with ID 0x2BA01477
LOG: Failed to power up DAP
LOG: InitTarget() start
LOG: InitTarget() end
LOG: Found SW-DP with ID 0x2BA01477
LOG: DPIDR: 0x2BA01477
LOG: CoreSight SoC-400 or earlier
LOG: Scanning AP map to find all available APs
LOG: AP[2]: Stopped AP scan as end of AP map has been reached
LOG: AP[0]: AHB-AP (IDR: 0x24770011)
LOG: AP[1]: JTAG-AP (IDR: 0x02880000)
LOG: Iterating through AP map to find AHB-AP to use
LOG: AP[0]: Core found
LOG: AP[0]: AHB-AP ROM base: 0xE00FF000
LOG: CPUID register: 0x410FC241. Implementer code: 0x41 (ARM)
LOG: Found Cortex-M4 r0p1, Little endian.
LOG: FPUnit: 6 code (BP) slots and 2 literal slots
LOG: CoreSight components:
LOG: ROMTbl[0] @ E00FF000
LOG: [0][0]: E000E000 CID B105E00D PID 000BB00C SCS-M7
LOG: [0][1]: E0001000 CID B105E00D PID 003BB002 DWT
LOG: [0][2]: E0002000 CID B105E00D PID 002BB003 FPB
LOG: [0][3]: E0000000 CID B105E00D PID 003BB001 ITM
LOG: [0][4]: E0040000 CID B105900D PID 000BB9A1 TPIU
LOG: [0][5]: E0041000 CID B105900D PID 000BB925 ETM
LOG: RTT Viewer connected.

Any ideas? Am I supposed to flash something else I don't know about? Is it possible we've not provided the chip with something it needs to run? Any help you could provide would be most appreciated.

  • Hi

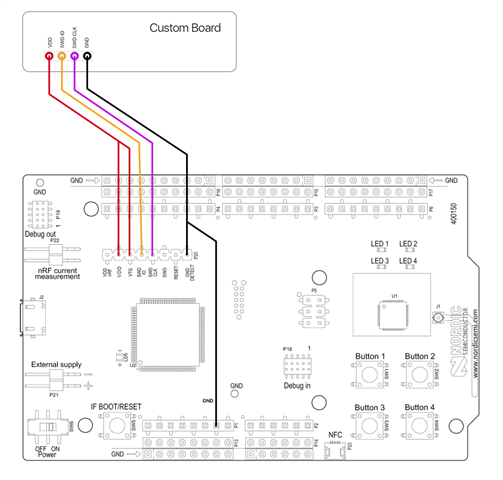
    Just to make sure, this is a custom board on your end that you're having trouble flashing, correct? Can you confirm that you've connected the DK and custom board as the picture below where the custom board runs at 3V:

    You can try doing an eraseall or recover manually by calling nrfjprog --eraseall or --recover. If you'd like, we can do a HW review of your custom board to make sure that everything is set up correctly. Let me know if you'd like me to set this case to private mode so you can upload your schematics and PCB layout here. In private mode, only yourself and Nordic engineers will be able to see it and it will be treated with confidentiality.

    Best regards,

    Simon

  • I was not having trouble flashing, but after the program was flashed it would not run.

    For the sake of other developers, the problem, it turns out, is that DCDC converters were being enabled in the zephyr kconfig but the new target doesn’t have the required hardware to enable these features. You can get around this problem by disabling the DCDC converters in prj.conf:

    CONFIG_BOARD_ENABLE_DCDC=n
    CONFIG_BOARD_ENABLE_DCDC_HV=n

Related