Debug in VSCode problem

My setup:

Our own PCB with nRF5340

Debugger = nRF5340 DK

macOS 13.2.1 (22D68)

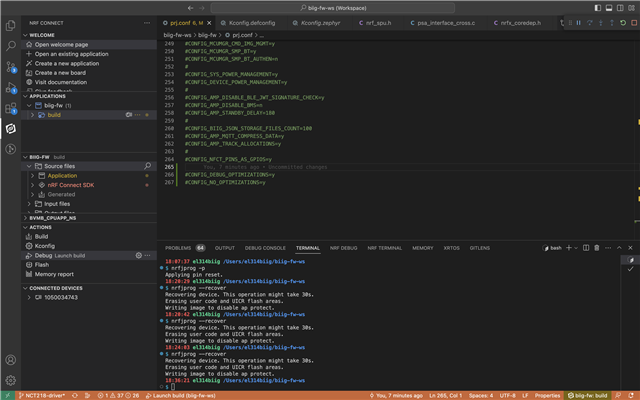
Project with T2: Star topology, application is the manifest repository. The only external files used by project is Toolchain aka zephyr-sdk-0.15.2.

I have such a problem. Debug in VSCode doesn't work as it is supposed to.

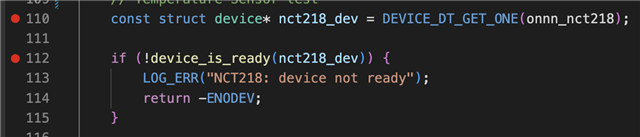
(!) If I don't tick Enable debug options in Edit Build Configuratioin then by pressing Debug Launch build I can debug but with stipulations. A part of my code is not accessible, probably it optiized, breakpoints are ignored and this code is never touched by the processor/compiler/system.

- How to workaround this? How not to optimize my code?

- + I have played with some config like DEBUG_OPTIMIZATION and NO_OPTIMIZATION, my code just can't be built.

- Why I even have a possibility to run Debug if  I didn't tick Enable debug options in Edit Build Configuratioin?

(!) If I tick Enable debug options in Edit Build Configuratioin then by pressing Debug Launch build my program just runs as it would be run after Flashing (w/o Debug). But I have that DEBUG CONSOLE OUTPUT with some information so the last lines are:

Thread 4 received signal SIGTRAP, Trace/breakpoint trap.
[Switching to Thread 3939856308]
There are even debug flow buttons. But they doesn' work, only Pause, Restart and Stop are available and Pause doesn't do nothing, Restart breaks everything so that even nRF5340 DK is not available anymore.
What's going on there?
Parents
  • Hi,

    Could you provide more information about your application?

    A part of my code is not accessible, probably it optiized, breakpoints are ignored and this code is never touched by the processor/compiler/system.

    Which part of your code is not accessible and from where?

    If I don't tick Enable debug options in Edit Build Configuratioin then by pressing Debug Launch build I can debug but with stipulations.

    Which button do you refer to as Debug Launch? What are the stipulations?

    I have played with some config like DEBUG_OPTIMIZATION and NO_OPTIMIZATION, my code just can't be built.

    I assume you used CONFIG_DEBUG_OPTIMIZATIONS. Is this correct? Could you show the log of failed build?

    Why I even have a possibility to run Debug if  I didn't tick Enable debug options in Edit Build Configuratioin?

    You are able to use Debug because normal debugging can be used even if enable debug options are not included. Selecting Enable Debug Options enables advanced debugging options, such as thread aware debugging.

     If I tick Enable debug options in Edit Build Configuratioin then by pressing Debug Launch build my program just runs as it would be run after Flashing (w/o Debug). But I have that DEBUG CONSOLE OUTPUT with some information so the last lines are:

    Thread 4 received signal SIGTRAP, Trace/breakpoint trap.
    [Switching to Thread 3939856308]
    There are even debug flow buttons. But they doesn' work, only Pause, Restart and Stop are available and Pause doesn't do nothing, Restart breaks everything so that even nRF5340 DK is not available anymore.

    Could you please rephrase the following part "by pressing Debug Launch build my program just runs as it would be run after Flashing (w/o Debug)"?

    Best regards,
    Dejan

  • 1. For example this part:

    *1* const struct device* nct218_dev = DEVICE_DT_GET_ONE(onnn_nct218);

    *2* if (!device_is_ready(nct218_dev)) {
    LOG_ERR("NCT218: device not ready");
    return -ENODEV;
    }
    *1* is the first breakpoint. It's not available, just disappear in debug.
    *2* is the second breakpoint. Debug moves it to the next line but I want to dive into exactly that statement. What's wrong?
    2. Debug button in the nRF Connet extension for VSC
    3. Stipulations are: A part of my code is not accessible, probably it optiized, breakpoints are ignored and this code is never touched by the processor/compiler/system.
    4. File attached12453.log.log
    5. Could you please explain what does it change and where? I mean that Tick in GUI in VSC.
    6. Rephrasing: If I tick Enable debug options in Edit Build Configuratioin then it doesn't matter if I press Debug or Flash, my program runs ignoring all the breakpoints there is not Debug related menu, register's values on the left side of the screen. See the screenshot. The only attribute I see is Debug flow control in ther right upper corner.
  • Hi,

    elektron314 said:
    *1* is the first breakpoint. It's not available, just disappear in debug.

    Could you explain in which way it is not available and how it disappears in debug?

    elektron314 said:
    *2* is the second breakpoint. Debug moves it to the next line but I want to dive into exactly that statement. What's wrong?
    elektron314 said:
    3. Stipulations are: A part of my code is not accessible, probably it optiized, breakpoints are ignored and this code is never touched by the processor/compiler/system.

    Build optimizations prevent setting the breakpoints on the lines which do not exist in the final build. 

    elektron314 said:
    6. Rephrasing: If I tick Enable debug options in Edit Build Configuratioin then it doesn't matter if I press Debug or Flash, my program runs ignoring all the breakpoints there is not Debug related menu, register's values on the left side of the screen. See the screenshot. The only attribute I see is Debug flow control in ther right upper corner.

    Which debugger do you use?

    Best regards,
    Dejan

Reply
  • Hi,

    elektron314 said:
    *1* is the first breakpoint. It's not available, just disappear in debug.

    Could you explain in which way it is not available and how it disappears in debug?

    elektron314 said:
    *2* is the second breakpoint. Debug moves it to the next line but I want to dive into exactly that statement. What's wrong?
    elektron314 said:
    3. Stipulations are: A part of my code is not accessible, probably it optiized, breakpoints are ignored and this code is never touched by the processor/compiler/system.

    Build optimizations prevent setting the breakpoints on the lines which do not exist in the final build. 

    elektron314 said:
    6. Rephrasing: If I tick Enable debug options in Edit Build Configuratioin then it doesn't matter if I press Debug or Flash, my program runs ignoring all the breakpoints there is not Debug related menu, register's values on the left side of the screen. See the screenshot. The only attribute I see is Debug flow control in ther right upper corner.

    Which debugger do you use?

    Best regards,
    Dejan

Children
Related