GDB error when trying to launch debugger

Hi,

I'm developing using vscode and Nordic pluggin, Windows 10 OS. When I try to launch debugger, I get the following message:

"Unable to start debugging. Unexpected GDB output from command "-target-select-extended-remote 127.0.0.1:63241". Remote communication error. Target disconnected.: No such file or directory."

The launch configuration is the default:

How can I make it run?

Thanks in advance,

Pedro.

Parents
  • Hi Pedro,

    Are you trying to debug a DK or a custom board? Is the device directly connected to the computer with an USB cable, or are you using an external debugger?

    Please provide support information from the VS Code extension:

    1. Open the command palette (Ctrl + Shift + P or View > Command Palette).
    2. Write "nRF Connect: Generate support information" and press enter.
    3. Copy the entire support information output.
    4. Upload it here using Insert > Code or upload a .txt file with Insert > Image/video/file.

    Make sure to remove confidential information you do not want to be shared in a public case.

    Best regards,
    Marte

  • Hi Marte,

    Thanks for your help. I've attached the generated support information.

    support information.zip

  • Hi,

    Are you trying to debug a nRF52 DK or a custom board? Is the device directly connected to the computer with an USB cable, or are you using an external debugger?

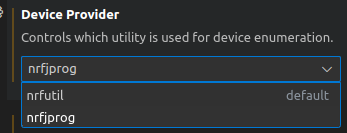
    Can you try selecting 'nrfjprog' as Device Provider instead of nrfutil?

    Best regards,
    Marte

Reply
  • Hi,

    Are you trying to debug a nRF52 DK or a custom board? Is the device directly connected to the computer with an USB cable, or are you using an external debugger?

    Can you try selecting 'nrfjprog' as Device Provider instead of nrfutil?

    Best regards,
    Marte

Children
  • Hi Marte,

    It's a custom board and I'm using external debugger J-Link Base. I can flash the code but not debugging. In the past I could debug with same board.

    I tried 'nrfjprog' as Device Provider but same error.

    As it worked in the past. Maybe should I downgrade GDB? How? Reinstall... something?

    Kind regards,

    Pedro.

  • Hi Marte. Still not working. Any idea?

  • Hi Pedro,

    I have asked the development team about this, and I am waiting on a response from them. I will let you know when I hear back.

    Best regards,
    Marte

  • Hi Pedro,

    Do you know what Nordic related tools you have updated between when debugging was working and not, and when? For example nRF Connect for Desktop, JLink or similar. 

    Please try rebooting your computer. If this does not fix it, you can try the following:

    • Quit VS Code
    • Disconnect all JLink devices
    • Remove JLink installations and repeat the installation process
    • Reboot the computer

    Best regards,
    Marte

  • Hi Marte,

    Do you know what Nordic related tools you have updated between when debugging was working and not, and when? For example nRF Connect for Desktop, JLink or similar. 

    I'm not sure when it stopped working. I did a project about 8 months ago and worked. In middle has been updated nRF Connect for Desktop, nRF Command Line Tools and nordic vscode pluggin.

    Please try rebooting your computer. If this does not fix it, you can try the following:

    • Quit VS Code
    • Disconnect all JLink devices
    • Remove JLink installations and repeat the installation process
    • Reboot the computer

    I did all this and updated to last J-Link software version (7.88b). SEGGER - The Embedded Experts - Downloads - J-Link / J-Trace

    Now debbuger still does not work, but I have a different error:

    "Unable to start debugging. GDB exited unexpectedly with exit code -3 (0xFFFFFFFD)"

    Normal flashing works.

    Any idea?