GDB error when trying to launch debugger

Hi,

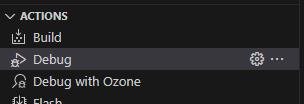
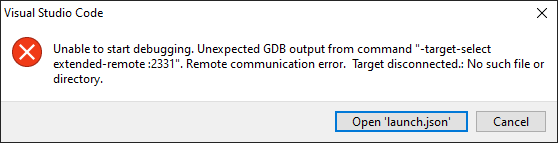
I'm developing using vscode and Nordic pluggin, Windows 10 OS. When I try to launch debugger, I get the following message:

"Unable to start debugging. Unexpected GDB output from command "-target-select-extended-remote 127.0.0.1:63241". Remote communication error. Target disconnected.: No such file or directory."

The launch configuration is the default:

	"launch": {
		"version": "0.2.0",
		"configurations": [
			{
				"type": "nrf-connect",
				"request": "launch",
				"name": "Launch build",
				"config": "${workspaceFolder}/build",
				"runToEntryPoint": "main"
			}
		]
	}

How can I make it run?

Thanks in advance,

Pedro.

Parents Reply
  • Hi Pedro,

    I got an update now.

    The developers have not been able to figure out what the issue is yet, but they are still working on it.

    Common for the reports of this issue is a fairly high port number. To rule out any issues with the port selection mechanism, can you try hardcoding the port number to the standard JLink GDB port?

    To do so you need to bind a custom launch configuration to the debug button by clicking the cogwheel on the right hand side of the action:

    Then, in the generated launch configuration, you need to add the following fields right after the config field:

    "serverAddress": ":2331",
    "serverArgs": "-if swd -device ${device} -select usb=${snr} -speed 12000 -port 2331 -singlerun -nogui -halt -noir -silent -rtos ${rtosPlugin}"

    Best regards,
    Marte

Children
Related