
Tell me if this has happened to you before.
You open some file, one you haven't touched in a while. This might be because you need to use an API, a coworker of yours wrote. Maybe it's a library or package you need to learn. Sometimes (and let this not be a reflection of my age!), you discover it's your own file, your own code, one that brings you to utter puzzlement. 'How did this end up being like this!?' you think. 'Who wrote this!?'. They call it git blame for a reason. Amirite?
Here's the thing. Nobody wants to be that person. But we don't live in a perfect world. The days of staying at home, coding on your own project, and doing things your own way were cool and brought many benefits. But in a day job, there are limits and time constraints. Even in an environment that fosters learning, making mistakes, and writing about them, such as Nordic, you want to be as efficient in your work hours as possible. Because time is a valuable thing, both for personal and professional use.
But in the real world, we make mistakes. We allow 'bad code' to linger in our projects, secretly judging us from a distance. And like going to the dentist or taking your car in for servicing after seeing that annoying warning on your dash for a month (tip: don't do that!), one day, you wake up, and you're ready to step into the arena with both feet.
Today, we will look at the 'new' nRF Connect for Mobile, version 2.x, that debuted back in the summer of 2019, and tear it to pieces. Like we did back in its day comparing it to its predecessor, it turned out that we managed to leave in quite a few bits of code we would like to backtrack on. And for many aspects of it, today is redemption day, with the recent release of version 2.5.
Stepping into the Cave
We're going to start with the catalyst (pun intended!) of all of this: the Graph Tab of nRF Connect for Mobile. Here's how it runs on the previous version when performing a default scan of 120 seconds. And for comparison, we show the last release of 1.x running beside it.
(Note: For the entire length of this post, our test device is an iPhone XR running the Apple A12 chip from 2018.)
 |
 |
Left: nRF Connect for Mobile1.x. Right: nRF Connect for Mobile 2.4.13
One is a lot smoother than the other. And when it comes to drawing the RSSI Graph in real-time, we're light years ahead of where we were. This is because the Graph Tab was the subject of a good chunk of optimization work back in the day (and it seems so long ago!). Back then, after making that code run much faster, we couldn't envision any other way in which we could kick the rest of nRF Connect for Mobile into faster gear. By all the metrics we could account for, version 2 was so much faster and more efficient in CPU usage than its predecessor, and it did so by executing fewer lines of code. In fact, nRF Connect for Mobile 2.4.13 still beats the last 1.x release as measured by cloc:
| Language (#lines of code) | nRF Connect 1.x | nRF Connect 2.4.x | ∆ (% of 1.x) |
| Swift | 35819 | 34487 | 96% |
| Objective-C | 45728 | 6 | ~0% |
| TOTAL (adding others) | 113394 | 51872 | 46% |
Of course, software shouldn't be measured by the number of lines of code it has. But taking into account that the newer release included tests, and that its logic covered more features than the original release, we could say that, objectively, we were doing pretty good. This was a good workspace to be working in. But that's where 2022 comes in. After a 2021 largely spent working on a new project you'll hear about soon, we landed back in nRF Connect for Mobile with a fresh mindset. And with Covid restrictions easing up a bit, we were able to grab some sample data of all the BLE traffic at Nordic HQ. The result of playing this back in nRF Connect for Mobile, using the newest version at the time, horrified us.

We saw an app that did not work when scanning 420 devices at the same time. It was jerky, largely unresponsive, did not draw graphs, and after tapping everywhere to try and get it to react we still didn't know what to do. You could argue that this scenario is out of the ordinary given the high amount of BLE traffic. And in your particular use case, it could very well be so. We're not here to argue that. But in our case, our apps are tools - developer tools. And we want our tools to be used wherever they're needed. If our HQ is filled with this many devices, chances are our customers have offices with a similar amount of traffic, or perhaps even more. This means this is an issue that warrants our attention. Because not only is the app barely responsive with CPU usage above 100% in this scenario, but the Graph is downright broken. When used in this scenario, it's as if we've gone back to the 1.x release of nRF Connect for Mobile.
Here be Dragons
Therefore, our first target for optimization was the Graph code. We had no reason to believe the Scanner itself might be an issue; after all, it was choppy, but it worked. The Graph was the biggest offender. As we mentioned previously, we had that part of the codebase labeled in our minds as 'solved' and 'as good as it is gonna be'. But when we opened the file in charge of keeping the graph up to date, to our horror, we discovered the loop executed in the background looked something like this:
for i in 0..<chartData.numberOfDataSets {
    guard let xMax = chartData.sync_mainQueue_xMaxFor(i) else { continue }
    let sinceX = max(0, xMax)

    let entries = optimisedAlgorithmToObtainNewDataPointsFor(i)
    chartData[i].sync_mainQueue_add(entries)
}
AHA! You must say. How could you be so stupid!?
Before you decide to snap your fingers and erase us from existence, let us explain: our graph library, Charts, does not like accesses from background queues/threads. It wants its calls on the main queue, or it will crash without mercy (it's a bit more complicated than that, but you get the point). The best way to do this, and keep the data points as accurately as possible, is to only lock when necessary and get out of the way whenever possible. When we saw this we were giddy with excitement. Of course, this code is choking when iterating over hundreds of devices! This is locking up to two times into the UI thread, per device, per draw call, on the graph. That's at least 800 locks on the UI thread from a background thread per second! And not only is the operation to update the graph going to be slow, but with the added pain of missing our callbacks for not being fast enough to draw on it, when the user eventually decided they wanted to stop scanning for devices, stopping wasn't going to be immediate.
So instead, we changed the code to lock only once per device:
let xMaxValues = chartData.sync_mainQueue_xMaxValues()
var allEntries = [[Entry]]()

for i in 0..<chartData.numberOfDataSets {
    let xMax = xMaxValues[i]
    let entries = optimisedAlgorithmToObtainNewDataPointsFor(i)
    allEntries.append(entries)
}

chartData[i].sync_mainQueue_add(allEntries)
Now, we are adding potential misses for newer data points as more and more Advertisement Data packets are being scanned and processed by other parts of the app. And since we have so much data to process anyway, it shouldn't matter in the larger scheme of things. What matters is we now have a significant reduction in the number of locks on the Main Thread. We lock once to gather all the xMax values we need per device to calculate the new RSSI Graph entries, and after calculating all the new data entry points, we lock again to add them all at once. Simple. And just by changing when we lock, rather than the logic itself, we fixed the problem without the need to rewrite all the logic and remember how all of these calculations worked. So, we ran the code again and...
It was the same.
As you can see, this isn't faster, and it is the app running with the updated code.
So what was actually happening? Instruments corroborated the fact that the graph code on the background thread was running faster because, over the course of the test run, it was able to execute 3x the number of calls to update the graph on the same data set within the same amount of time. If the same logic, over the same amount of time, is being executed more times, it means it takes less time to run, and therefore it's faster. There was also a slight improvement in that stopping the Scanner now meant the Graph 'stopped' faster. So we were doing better. But the graph still didn’t draw in real-time despite how much better the code was. What was going on, and why wasn’t this the fix?
The Recommended Way to Synchronize Code
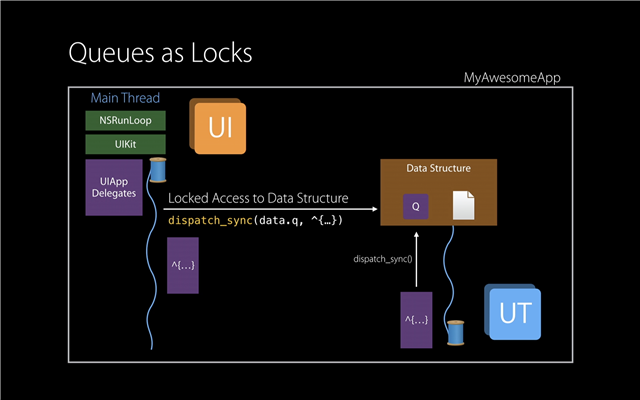
Source: WWDC 2015 Talk 'Building Responsive and Efficient Apps with GCD'
Well, it turned out, we were not morons after all.
Contrary to Semaphores and Mutexes, the Swift Runtime is much more aware of code using Dispatch Queues. In fact, it is Apple's recommended way to protect code in which you'd like to enforce a mutual exclusion principle (note: our target API remains at iOS 9 for the time being), because by using a DispatchQueue, it can actually translate a dispatch_sync call into a lock. One that doesn't even spin, even. Which means it's very efficient. And the reason why our horrible code didn't significantly alter the performance of the app when it was locking into the UI Thread so many times, is because DispatchQueue(s) have associated Quality of Service tags, or affinities, associated with them. And so by being aware that our locks into the main UI Thread came from an NSOperation in the background, it locked in spaces in time where the work had less priority. So in fact, we were never blocking UI requests such as touch events and so on from the user. This is why even though our efforts were not in vain, they barely made an impact on the overall user-level performance. The app was still slow and broken when scanning and processing events from hundreds of devices.
We needed to look elsewhere. Running Instruments, we dived into Charts, and whilst we found the 'rendering' calls to be extremely slow, they did not explain a funny thing we noticed when running the app with just the Scanner alone: the Scanner itself was not efficient. The Graph-drawing code of Charts for the RSSI Tab might not be helping us a lot, but our own code was responsible for chugging the CPU all by itself. In fact, if we ran the Scanner by using only the devices on our desk, without simulating the environment at Nordic HQ, we discovered that the CPU usage increased over time all on its own:
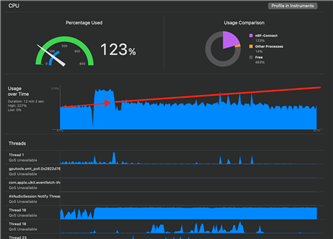
Unfortunately, try as we might nRF Connect for Mobile refused to behave as we saw it do during development. So we mocked it up instead.
Taking Responsibility
Now it was time to roll up our sleeves and find out where the code was being slow. Rather than making assumptions, it was time to let the data speak for itself. If the Scanner slows down with more Advertising Packets, even with a small sample of devices, there has to be some inefficiency somewhere. We pulled Instruments, we ran our Advertisement Packet bombardment test so that the results would be easier to see, and when we started digging down through the most-used call-stacks inside Instrument, this emerged as the culprit:
subscript(device: Bluetooth.Device) -> Bluetooth.Device? {
    guard let index = scannedDevices.firstIndex(of: device) else { return nil }
    return scannedDevices[index]
}
This code is run about 2x per Advertisement Packet received. If every device advertises twice per second, and we are testing 400 devices, that is roughly 1600 calls per second. It is used because the scanned Bluetooth.Device type is no longer a class (reference-based), but a struct. This change alone saved us a big chunk of memory use in a prior version of nRF Connect for Mobile (specifically 2.3.2 released back in July 2020). But moving values around means that we need to be careful when we modify them, and so when we find the need to append a new Advertisement Packet to the Single Source of Truth struct of a Bluetooth.Device, we need to find where it is in the SSOT, and update it there. This means finding it in the array of Scanned Devices and updating that value of the device, hence the need to find it in the array. (Yes, I know inout exists but it does not apply to this call stack, so leave us alone.) And the fact that this code was called twice per Advertisement Packet received, explained not only why the CPU usage increased over time as more devices were scanned: O(n) call per device, so O(n2) escalation as the number of devices grows into the hundreds, all of them pinging new Advertisement Packets multiple times per second.
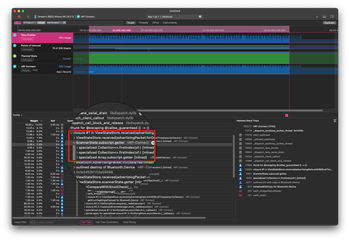
Screen capture of an Instruments run highlighting our indexOf() bottleneck in the array of devices.
Needless to say, we solved this by using a cache property in our code. Every time there's a need to find the index of a device in the Array, we query the cache and check if the returned index matches which device we're looking for. If not, we reset the cache's value and update it, which in the worst case, should only happen once per scan, as a Pull-to-Refresh action would invalidate the cache. We also clear out the cache in that case as well, but we thought it best to proceed in applying some defensive programming given how important this section of code is.
When the Dragon turns out to have been a Hydra
Immediately after implementing the index optimization, we proceeded to re-run the app under Instruments. We didn't even check visually if the app was performing better or not, we just gave Instruments the power to decide whether we were on the right path or not. And instead of seeing the previous subscript as using large amounts of CPU time, we saw something else. After some digging, we tracked it down to this bit of code:
func roundToPlaces(_ places: Int) -> Double {
    let divisor = pow(10.0, Double(places))
    return (self * divisor).rounded() / divisor
}
Let me explain: in nRF Connect for Mobile we show the interval in milliseconds between Bluetooth advertisements received. Rather than storing this value as an Integer, like money, we saved it as a full-on Double. But as a form of premature optimization (hold on; keep reading), we thought it best to cut off the unnecessary decimal values that we weren't going to use as soon as possible. Since this was a common use case, we turned it into a function. Instead of using the number 10 multiplied by itself some number of times, we thought it best to rely on the framework's pow() API, thinking it'd be well optimized. And as Apple chips are ridiculously hand-crafted, we thought the floating-point code wasn't going to give it a sweat. We assumed, in LLVM, someone must've predicted some code as this being needed and made sure it ran like butter on the new silicon. But no: this was a big cause of the slowdown. It originally showed itself in another function as part of our code hot spot, the one we use to determine whether two Advertisement Packets are 'the same', which in our case means they are so close to each other that we can drop them:
static func == (lhs: Bluetooth.AdvertisingPacket, rhs: Bluetooth.AdvertisingPacket) -> Bool {
    return abs(lhs.timestamp.intervalInMs(from: rhs.timestamp)) < Bluetooth.BroadcastInterval.min
}
And, you guessed it: this intervalInMs() function, used by the UI Thread when displaying the cells in the Scanner for each device, used our aforementioned dog-slow roundToPlaces() code:
func intervalInMs(from date: Date) -> TimeInterval {
    return timeIntervalSince(date).roundToPlaces(3).ms
}
Our discovery was that the following code turned out to be a lot faster to determine whether two Advertising Packets were in close proximity to each other:
static func == (lhs: Bluetooth.AdvertisingPacket, rhs: Bluetooth.AdvertisingPacket) -> Bool {
    return abs(lhs.timestamp.timeIntervalSince1970 * 1000
        - rhs.timestamp.timeIntervalSince1970 * 1000) < Bluetooth.BroadcastInterval.min
}
This leads us to the code used to display the Interval in the cells. Instead of making the number smaller and cutting off / rounding the decimals, it turns out, it's just easier and faster to only display the decimals that we need:
static var interval: Formatter {
    Formatter(function: {
        guard let interval = $0 as? TimeInterval else { return Strings.notAvailable.localized() }
-       return "\(interval.roundToPlaces(2)) ms"
+       return String(format: "%.2f ms", interval)
    })
}
This is a lot faster! And with all of these changes, the results speak for themselves:
Not perfect, for sure. But much better. Wouldn't you agree?
The Need, for Speed
Of course, chasing performance is one of those things that, like Software Architecture, the bottomless list of tickets marked as #techdebt, and maintenance of your codebase's file structure that, you could be doing forever. There are developers whose job in big applications is to only take care of these issues. Teams even. But the point I wanted to illustrate here is that, despite what you might believe, and in accordance to what we've been preaching for a while, understanding how and where our code is running is quite important. And our previous use cases show that; the code we all believed had to be the culprit, was not. Though you could argue Charts is still slow and inefficient, it was not our main problem. The main causes for our bad performance were the lines of code we least expected them to be: an indefOf() call in an Array, and an 'optimization' to shave off decimal points instead of using Swift's built-in method to format floating-point numbers.
And this isn't the first time we've found that 'less efficient code', was discovered to be faster.
'Imported Files', accessible via Settings
A while ago, we introduced the 'Imported Files' feature, giving you a better view of which DFU files you'd already imported for use in nRF Connect for Mobile. Our first, dirty-code approach after realizing this could be implemented as a Tree-structure, was to use an Array as the backing data structure. Leaving a proper 'Linked-List' implementation for later, when all the logic and tests were up and running. But to our shock, when we switched the code over from an Array to a Linked List, opening Instruments to expect to see a big performance update, we were floored: even from the UI, the app looked dramatically slower. We thought it had to be something else that had broken the app, but nothing else seemed to be making use of the CPU, as the Scanner was off and the Graph was not visible. We reverted to a previous commit and contrasted the data with Instruments, and the numbers that we expected to see from a Linked List, were the ones that we saw for the Array.
But how is this possible? Arrays for small numbers of elements are supposed to be slow, you see. Adding stuff into an array, especially for a structure like a tree in which you don't know how many items you're going to need, means that the array needs to be constantly resized. And resizing means getting another bucket of memory where to store it, copy it there, and then adding the new element. Rinse and repeat until the memory allocated for the array is no longer enough for the new element, and then you start all over. Furthermore, with Array(s), as proven before, we need to be constantly searching for the index of an item in the tree. Granted, there are coding strategies to improve this, but the fact remains: with a Linked List, for traversal you just grab the pointer and 'head there'. That's it. How is it that the Array is much faster than a Linked List!?
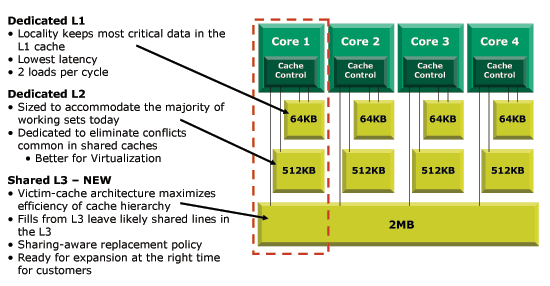
Source: Anandtech (Image is representative of modern CPUs, not specifically Apple)
Modern processor performance is based on a single concept: execute as many instructions of code as possible. The problem is that the CPU is so fast, that nothing ever comes close to it in terms of latency. Even Apple's own Unified Memory Architecture can't keep up with how fast a CPU core can fetch, decode, execute and retire instructions at full speed. So the solution dating back to the 80s is to add cache. Hardware cache, in a hierarchy, wherein the closer and faster to the CPU it is, the smaller it is to compensate for its increased cost. And the reason why Linked Lists are bad for performance is the same reason why our indexOf() code was so slow: that data the CPU was looking for was not being found in its on-chip hardware cache, so the CPU stalls, and waits for hundreds of cycles doing nothing because of how slow waiting for the main memory (RAM) to send it is. With a Linked List, every single item is in its own chunk in memory, represented by a pointer. Those chunks of memory are almost never going to be contiguous to one another, so the parts of the CPU that try to predict which data is needed ahead of time to avoid waiting for main memory will miss understanding these pointers as the Linked List that it is. In consequence, traversing a Linked List likely incurs in a CPU cache miss per item, which is a lot of time lost doing absolutely nothing for the CPU.
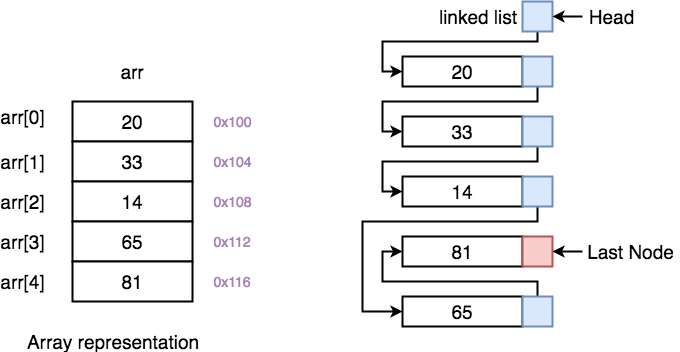
Source: Studytonight
By using an Array, we're keeping all the elements in a contiguous block of memory, so the CPU is able to reason we're accessing elements in succession, and pre-fetch them. That is, fill the CPU's cache ahead of time so the values are already transferred from memory before each instruction needs to be executed. This is why, despite how bad and painful we think growing or shrinking arrays in memory is, they still turn out to be the most efficient data structure we can use. Because the CPU can look ahead at our uses of it, and correctly guess what we're going to do with the array, pre-loading all of the values into its cache. This means the CPU will churn through all of the items in the array without having to wait for external trips to memory.
In a similar way, our previous function to obtain the index of a device might've been recognized by the CPU as a set of instructions that's used a lot (they're that smart), but as it was a function returning values that it could not understand were contiguous, these couldn't be cached. What was there to cache, anyway? For the CPU, this was a bunch of logic it couldn't understand. So now, both the compiler and the CPU can understand that there's a memory address for our cache values that's needed a lot; it's not as perfect as an array, but it's the same location used many times, so the CPU can understand it's important, store it inside its very fast cache, and access it much faster. Hence our dramatic improvement in speed.
Keep in mind: the lines of code we had in nRF Connect for Mobile brought to its knees an A12 processor from 2018. And the reason was not that the hardware was not fast enough, it was because we did not optimize. We thought we did, but we did not. Besides thinking CPUs and compilers will do the work, which is the correct assumption to make 99% of the time, the other branch many will cling to is the following saying:
“Premature optimization is the root of all evil.”
- Donald Knuth
Only this is not the right quote. This is:
"Programmers waste enormous amounts of time thinking about, or worrying about, the speed of noncritical parts of their programs, and these attempts at efficiency actually have a strong negative impact when debugging and maintenance are considered. We should forget about small efficiencies, say about 97% of the time: premature optimization is the root of all evil.
"Yet we should not pass up our opportunities in that critical 3%. A good programmer will not be lulled into complacency by such reasoning, he will be wise to look carefully at the critical code; but only after that code has been identified."
-Donald Knuth
Conclusion
A long and complicated write-up formed the conclusion this post for weeks (yes, these things take time to write)! But in the end, we realized that if you haven't gotten there for yourself, chances are you would not want to read about it anyway.
Here's the important part: watch out for the parts of the code you are least worried about, and always measure what you're doing when you want to make things faster. Don't assume upgrading to the latest chip will do the magic optimization work for you because as you've read above, that's now how it works. If your code is fast already, fast silicon will make it execute in less time all the while consuming less power. But it cannot read your mind. Computers were fast enough already, and if you're wondering why we didn't feel like it before, the answer is clear: software is getting slower faster than hardware is. And every time we receive one of these leaps in performance, our code pulls it back, underneath layers and layers of unnecessary complexity (I'm looking at you!).
And of course, remember that as an iOS or Mobile Developer, most of the code you're writing is executed on a battery-powered device. So faster, more efficient execution (i.e. optimization) not only allows your user's iPhone to stay cooler on their hands but also work for longer without needing a trip to the power bank or wall. All in all, it's a round-trip of benefits for everyone involved.