This post is older than 2 years and might not be relevant anymore
More Info: Consider searching for newer posts

Power Profiler Kit incorrectly reporting max current.

I have the PPK measuring a custom nRF52-based board. The board consists of the nRF52, a I2C sensor, and bunch of caps (210uF worth). We built a custom board to do current measurement (this was before the PPK was released). The custom board does essentially what the PPK does, except it uses a scope for the UI instead of a PC application.

According to my calculations from the nRF52 spec sheet, our board should be drawing a peak current of 6mA when the radio transmits at 0dBm (5.3 spec'd with DC-DC enabled rounded up). Our custom current measurement board is reporting 5.6mA peak current draw. The PPK is reporting 15mA to 25mA. That's a pretty big discrepancy.

If I load the nRF52 DK with essentially the same firmware (sensor code removed), the PPK reports a much more believable 8mA peak current draw.

But here's the fun part: the average current reported by the custom current measurement board and the PPK match up within a few hundred nA when measuring the nRF52-based board and the nRF52 on the development kit. The PPK is reporting 14.5uA average. The custom current measurement is reporting 14.8uA average.

Hopefully that makes sense.

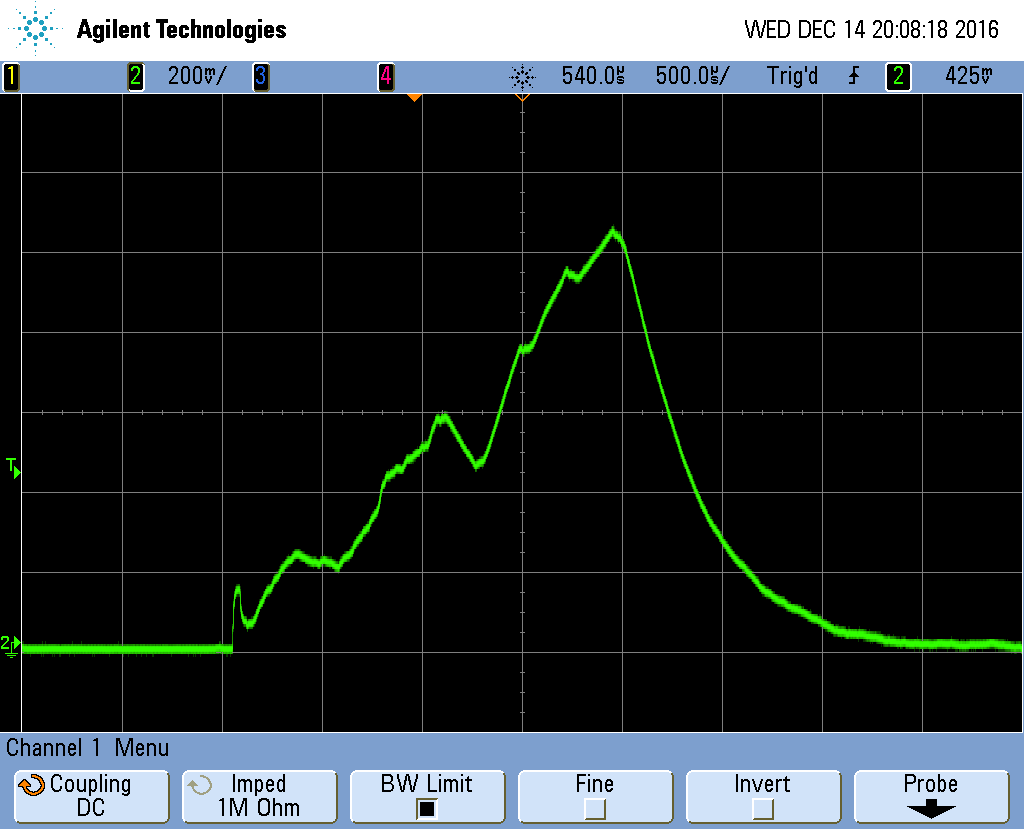
Here's a screen shot of the peaks. image description

Here's what the scope is seeing with our current sense board (all analog). The scale is 200mV / mA. The peak is typically in the 1.06V range, which means peak current draw is 5.3mA (1060mV / 200mV). There are a lot of caps on the DUT, which is why the waveform is smooth. I'm not super concerned over the peak current not getting accurately reported. I have a sneaking suspicion the device under test is causing some oscillations on the PPK, because the same FW loaded onto the nRF52 DK reports accurate peaks current.

image description

  • Good to hear that the average current is at least within acceptable limits for your application. With regards to the peak current; do you see this in both the average and the trigger window? We know that due to higher sampling rate, the trigger window may some times report high peaks when there actually aren't any. These peaks comes from the fact that the hardware is doing its automatic switching which may cause false, larger peaks to show in the trigger window.

    How many samples are the peak currents in each application?

  • I updated m question with a screenshot. How can I determine the sample count?

    I let the PPK and DUT sit over weekend unpowered, and when I started it up this morning, it's bouncing between 3 mA and 22-24mA. One peak will be 3mA, but then next one might be 22mA, then 18mA. The average current consumption is still right where I expected it to be, so I'm not super worried.

  • The ramp up in the beginning of the trigger plot actually looks quite sane to me, but then again, I don't exactly know which part of the application that is measured. The average window peaks seems abnormal, and of course, the average is good since the peaks are so short. The only way to see how many samples is to zoom in and count every 13µs in the trigger window, 130µs for the average window. It looks like it is a short burst and can be explained by the switches. We will look into this for the next release, so hopefully you'll get a new fw/sw pack that will fix this.

Related