This post is older than 2 years and might not be relevant anymore
More Info: Consider searching for newer posts

Any tutorial on how to read the measurements reported by the PPK?

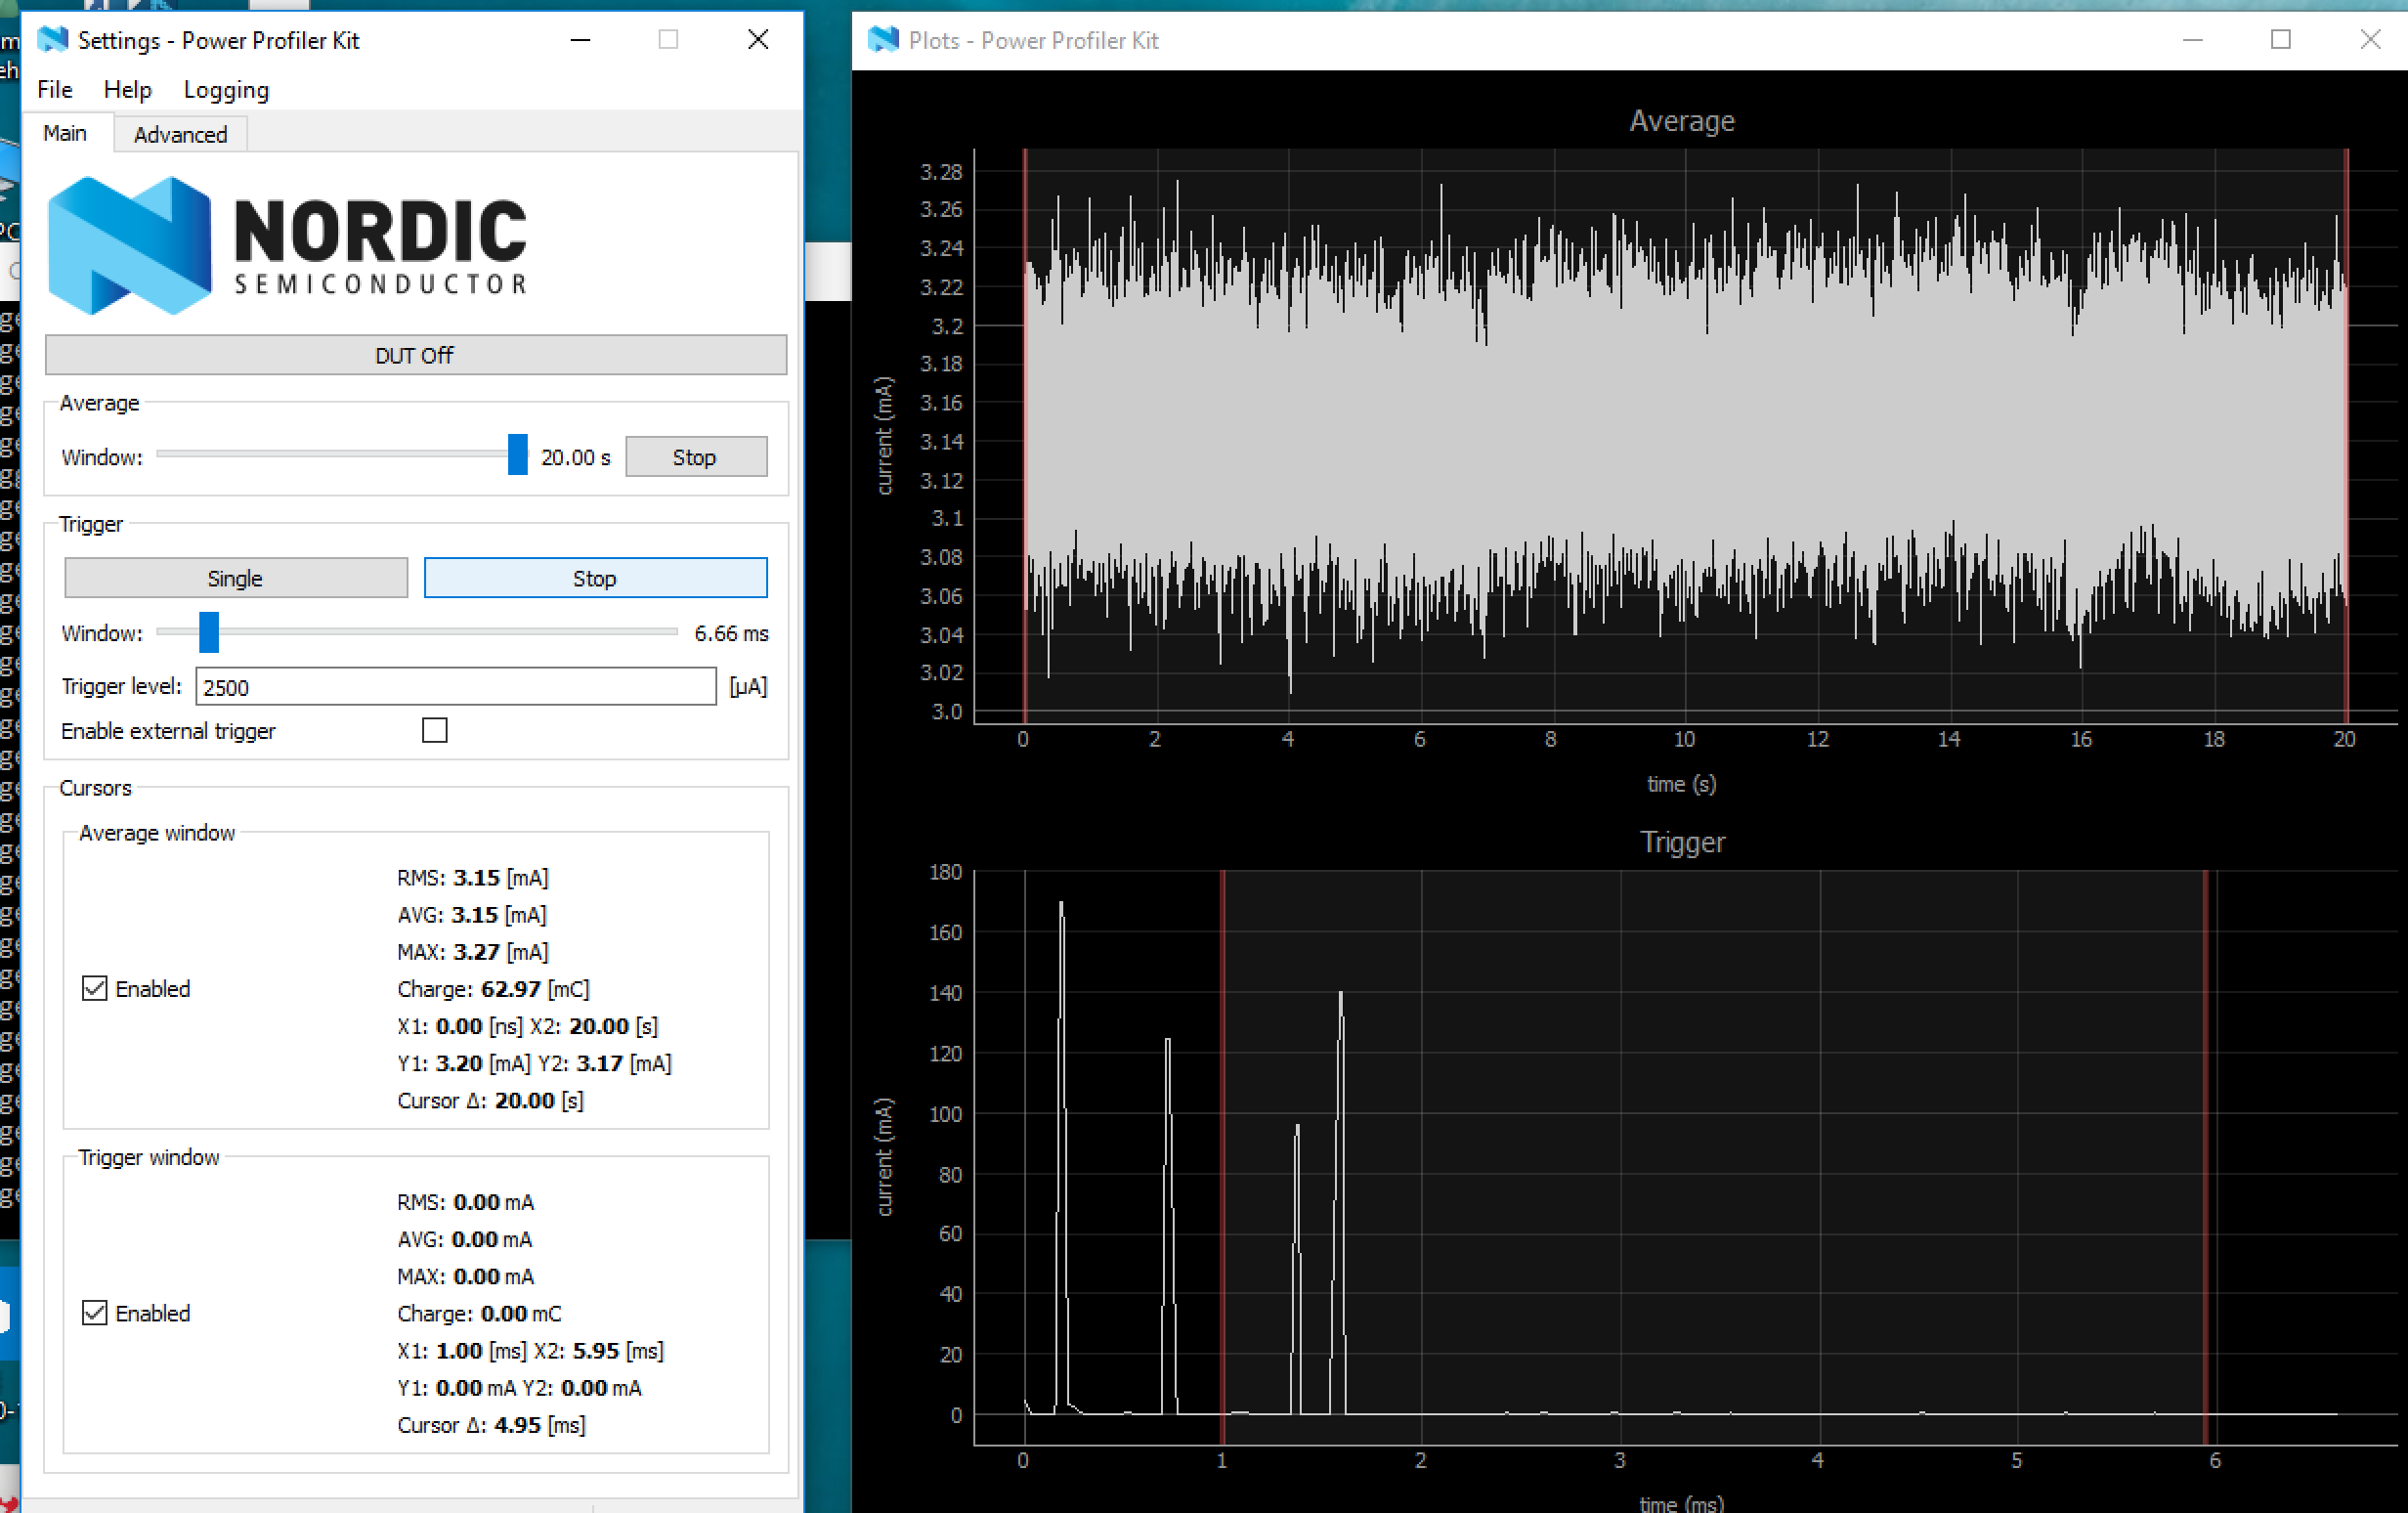
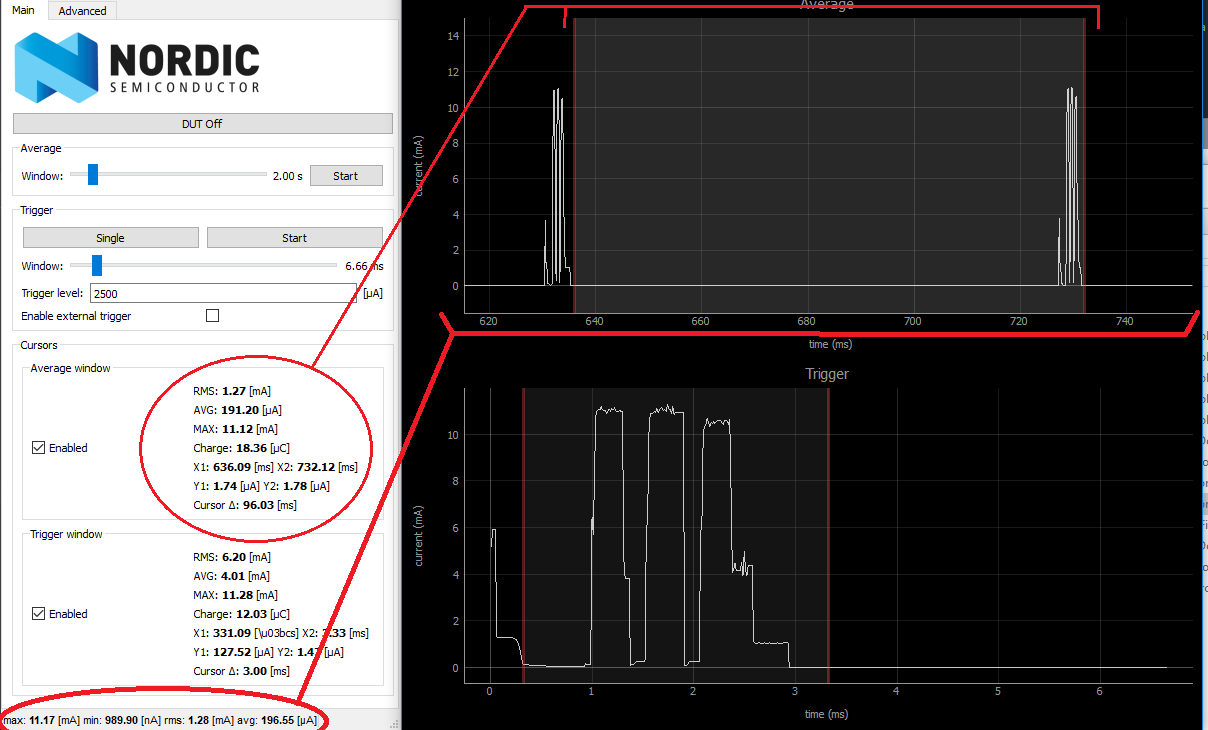
I've gone through the user manual for the Nordic Power Profiler Kit, but I can't find any basic information on how to understand the plots and the measurements reported under the Average and Trigger windows. For example, are there any step-by-step guides for best practices or practical steps on how to measure the current draw and power consumption and how to make sense of the values?

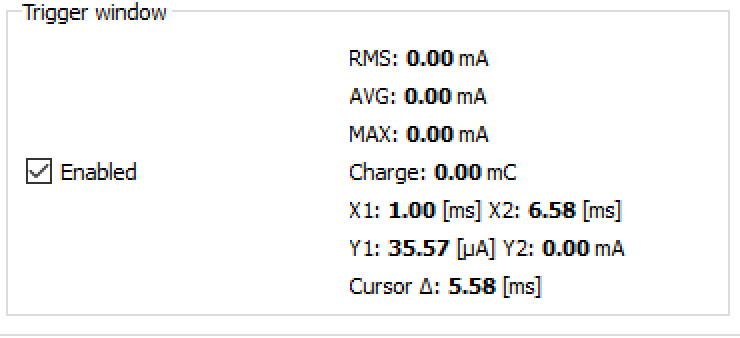
Also, one thing I'm seeing is that the values shown in the Trigger window are at zero and don't change (see attached picture).

image description

image description

  • There are no step by guide on how to use the numbers per se, but the docs explains what the different measurement sets describes, i.e what in the graph you are measuring.

    Can you also attach what you are seeing in the trigger window? This will be 0 if there are no data in the trigger chart (which only happen when the consumption has reached the trigger point set in microamps).

    The best way to read current from your DUT, is to let it run and do a cursor measurement between events you know happen at a defined interval. E.g, if you have a beacon application, that does nothing between sending some packets on air, you will have a spike in your measurement upon every radio event. Place the cursors (using the average windows) right after each event and read the AVG number from the cursor measurement.

    You will also get a continuously updated measurement at the very bottom of the settings window, showing the average consumption for the whole average window.

    The trigger window is just there to let you look at your events of interest in more detail, they don't help you much with measuring the overall current consumption of your application.

    Trying out my mspaint skills, and have here set my cursors to where I would put them to read the average measurement. Either that, or let it roll for a couple of seconds and read out the numbers at the bottom, in case something else is happening between the radio events.

    ppk measurements

  • Thanks, @wilhelmsen.

    The zero-values issue in the Trigger happens intermittently, but I'm attaching a picture nonetheless (in the original post).

    Some of the things I'm noticing:

    • The Trigger plot is still active, meaning it is drawing values, even when it's disabled and/or Stopped from the Trigger control section. Is this normal?
    • If I stop both the Average and Trigger, the plots eventually stop drawing values, but only after a few seconds (it used to take up to 60 secs or more, but I made the change discussed in this post).
    • I'm still seeing delays, even with the above change to the Python script, which makes it really difficult to measure the readings from an event trigger in the firmware such as pressing a button.
  • This is weird, and the trigger nor the average should keep running after issuing stop. Seems like there are package errors in the transfer.

    • Can you tell me more about your system and setup?

    • Is this behavior seen from the very beginning, and if not, how much time does it take to behave like this?

    The first thing you could try is to not run trigger and average at the same time, see if that makes any difference. I have seen the delays you're mentioning, but after removing the logger it has been close to perfect. If both trigger and average has been running for too long together, the jlink seems to get congested and you'll might notice this behavior. The docs say to not use both because of this reason. If you have an extra debugger available, you can also try that. I might build a new firmware, that is sending less often to see if that might fix it for those having this issue

  • This is what my current setup looks like:

    • Using nRF52832 dev kit
    • I'm running this on a mac in a Windows Virtual machine (VirtualBox) - (not sure if this really makes a difference)
    • Firmware running on the nRF52832 is the BLE throughput demo firmware
    • I have a serial terminal program open (need it to control the throughput demo) and detect when I need to stop the capture

    I tried disabling the Trigger right away after starting PPK, and it seems to behave much better. However, I still see a big delay when stopping the average capture (and in displaying the data in realtime). For example:

    • I press the button on the board to start data transfer
    • It starts and I see it in the serial output
    • I wait till it finishes transferring then I press stop in the Average control panel
    • The data/plot keep rolling in and most of the time it stops after the relevant measurements during the data transfer have passed and are now outside the window.
    • So, in the end, the data that I'm interested in disappears off the plot and there's no way to go back to it.

    Any ideas why this could be happening? Suggestions on how to fix/work around it?

    Another question related to the software, what's the difference between Stopping and unchecking the Enabled checkbox? Are they different? and if so, how?

  • Running this in a virtual machine, on a mac seems like the bottle neck for sure. The segger connection needs to have the least amount of routes to the application, and explains the severe delays that you have. Also, mac is not supported officially, since we have never been able to get a stable measurement stream using mac. So for some reason the underlying driver for the J-Link OBD is not up to speed with what the ppk needs on a mac.

    I would really advise to try this either on a native windows computer or a Linux machine (not officially supported, but made working by a lot of users).

    The difference between stopping and enabling checkbox is that STOP stops the average data from incoming, while the marker checkbox just removes the markers. You might need to remove them for doing e.g. screenshots.

Related