Seeking MPSL ASSERT 112, 2195 cause

Another  MPSL ASSERT 112, 2195  instance.

I am experiencing it now regularly usually directly

after servicing my first breakpoint after boot, then continuing.

The next mouse-click of pause after 1st continue, and execution is looping in fatal.c .

(arch_system_halt).

What is causing 112, 2195 ?

(VS-Code/Segger Base/custom pcb nrf52840) // nrf52840 DK BLE Standalone// nrf52840 DK Sniffer//

======================================

(VS-Code/Help/About)

Version: 1.76.0 (user setup)
Commit: 92da9481c0904c6adfe372c12da3b7748d74bdcb
Date: 2023-03-01T10:22:44.506Z
Electron: 19.1.11
Chromium: 102.0.5005.196
Node.js: 16.14.2
V8: 10.2.154.26-electron.0
OS: Windows_NT x64 10.0.22621
Sandboxed: Yes

=======================================

[00:00:30.605,316] <err> mpsl_init: MPSL ASSERT: 112, 2195
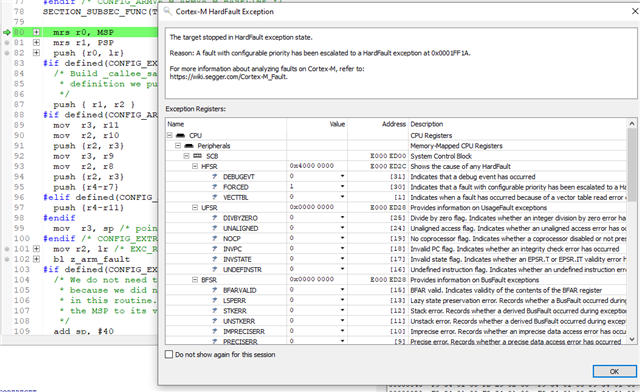
[00:00:30.605,346] <err> os: ***** HARD FAULT *****
[00:00:30.605,346] <err> os: Fault escalation (see below)
[00:00:30.605,377] <err> os: ARCH_EXCEPT with reason 3

[00:00:30.605,407] <err> os: r0/a1: 0x00000003 r1/a2: 0x20002c68 r2/a3: 0x20002c68
[00:00:30.605,407] <err> os: r3/a4: 0x00045a9f r12/ip: 0x00000000 r14/lr: 0x000409fd
[00:00:30.605,438] <err> os: xpsr: 0x61000018
[00:00:30.605,438] <err> os: Faulting instruction address (r15/pc): 0x0003a9f4
[00:00:30.605,499] <err> os: >>> ZEPHYR FATAL ERROR 3: Kernel oops on CPU 0
[00:00:30.605,499] <err> os: Fault during interrupt handling

[00:00:30.605,560] <err> os: Current thread: 0x20002c68 (idle)
[00:00:30.979,431] <err> os: Halting system


==========================================

arch_system_halt(unsigned int reason) (c:\nordicsemi\v2.2.0\zephyr\kernel\fatal.c:32)
k_sys_fatal_error_handler(unsigned int reason, const z_arch_esf_t * esf) (c:\nordicsemi\v2.2.0\zephyr\kernel\fatal.c:46)
z_fatal_error(unsigned int reason, const z_arch_esf_t * esf) (c:\nordicsemi\v2.2.0\zephyr\kernel\fatal.c:131)
z_arm_fatal_error(unsigned int reason, const z_arch_esf_t * esf) (c:\nordicsemi\v2.2.0\zephyr\arch\arm\core\aarch32\fatal.c:63)
z_arm_fault(uint32_t msp, uint32_t psp, uint32_t exc_return, _callee_saved_t * callee_regs) (c:\nordicsemi\v2.2.0\zephyr\arch\arm\core\aarch32\cortex_m\fault.c:1097)
z_arm_usage_fault() (c:\nordicsemi\v2.2.0\zephyr\arch\arm\core\aarch32\cortex_m\fault_s.S:102)
<signal handler called> (Unknown Source:0)
m_assert_handler(const char * const file, const uint32_t line) (c:\nordicsemi\v2.2.0\nrf\subsys\mpsl\init\mpsl_init.c:176)
sym_S2UAPMFVIQXDUOA6CV7GJMB33TYHEUH5D6LHO5Q (Unknown Source:0)
sym_J5F7QGRFPKMLWRNSXZXS5YI7BM4DUTISCOASCOA (Unknown Source:0)
MPSL_IRQ_TIMER0_Handler (Unknown Source:0)
mpsl_timer0_isr_wrapper_body() (c:\nordicsemi\v2.2.0\nrf\subsys\mpsl\init\mpsl_init.c:130)
mpsl_timer0_isr_wrapper() (c:\nordicsemi\v2.2.0\nrf\subsys\mpsl\init\mpsl_init.c:128)
<signal handler called> (Unknown Source:0)
arch_cpu_idle() (c:\nordicsemi\v2.2.0\zephyr\arch\arm\core\aarch32\cpu_idle.S:108)
k_cpu_idle() (c:\nordicsemi\v2.2.0\zephyr\include\zephyr\kernel.h:5627)
idle(void * unused1, void * unused2, void * unused3) (c:\nordicsemi\v2.2.0\zephyr\kernel\idle.c:83)
z_thread_entry(k_thread_entry_t entry, void * p1, void * p2, void * p3) (c:\nordicsemi\v2.2.0\zephyr\lib\os\thread_entry.c:36)

==================================================================

  • You cannot use breakpoints to debug a BLE application when there is ongoing BLE activity. Check this thread for instance. Monitor mode debugging normally is helpful in this cases but I am not used this with Nordic Connect SDK. 

  • I have been developing and breakpoint debugging BLE code for several months

    with this tool set 2.1.2 and 2.2.0 with Advertisements and Data Connection transfers

    and have been using 2.2.0 for months.

    This seems to be a new problem (maybe for the past week or two) in VS Code which should be investigated.

    Debugging protocols like BLE with their inherent protocol timeouts occurring is commonplace --

    that should not cause a debugger to fail in such a dramatic manner.

    The tools seem to auto-update -- VS Code help/about gives a date that it says was "2 days ago".

    How would the user transition back to what was running 2 weeks ago ?

  • I tried to put a breakpoint in peripheral_lbs example as shown below and you can see that when the breakpoint is hit and I try to continue by from here

    I get this hardfault

    I am using nRF Connect SDKv1.9.1 and I see this limitation still there even in the older SDK than you were using before. Remember that you can debug your application and set breakpoints without issue before enabling the bluetooth.

  • That sample seems to have been removed from 2.2.0 and since

    it requires several available buttons and leds, it is targeted

    mainly at the DKs.

    As already stated, I have been using breakpoints in active BLE environments

    for months with no problems.

    However, this crash also occurs without breakpoints, after debug/flash

    (in vs-code), simply by clicking the pause/continue button 5 times --

    on that final (5th) pause, execution is looping in fatal.c .

    However, the most productive thing is to look at the aftermath exception data

    I have presented and state what could be causing this crash ?

    I am especially interested in 2 persistent crash ingredients:

    1)  the line:    <signal handler called> Unknown Source 0, and

    2)  what is the purpose of mpsl_timer0 and what does its persistent

    involvement in this system crash indicate ?

    Following is another iteration of this crash's exception data:

    ============================================================

    arch_system_halt(unsigned int reason) (c:\nordicsemi\v2.2.0\zephyr\kernel\fatal.c:32)
    k_sys_fatal_error_handler(unsigned int reason, const z_arch_esf_t * esf) (c:\nordicsemi\v2.2.0\zephyr\kernel\fatal.c:46)
    z_fatal_error(unsigned int reason, const z_arch_esf_t * esf) (c:\nordicsemi\v2.2.0\zephyr\kernel\fatal.c:131)
    z_arm_fatal_error(unsigned int reason, const z_arch_esf_t * esf) (c:\nordicsemi\v2.2.0\zephyr\arch\arm\core\aarch32\fatal.c:63)
    z_arm_fault(uint32_t msp, uint32_t psp, uint32_t exc_return, _callee_saved_t * callee_regs) (c:\nordicsemi\v2.2.0\zephyr\arch\arm\core\aarch32\cortex_m\fault.c:1097)
    z_arm_usage_fault() (c:\nordicsemi\v2.2.0\zephyr\arch\arm\core\aarch32\cortex_m\fault_s.S:102)
    <signal handler called> (Unknown Source:0)
    m_assert_handler(const char * const file, const uint32_t line) (c:\nordicsemi\v2.2.0\nrf\subsys\mpsl\init\mpsl_init.c:176)
    sym_S2UAPMFVIQXDUOA6CV7GJMB33TYHEUH5D6LHO5Q (Unknown Source:0)
    sym_J5F7QGRFPKMLWRNSXZXS5YI7BM4DUTISCOASCOA (Unknown Source:0)
    MPSL_IRQ_TIMER0_Handler (Unknown Source:0)
    mpsl_timer0_isr_wrapper_body() (c:\nordicsemi\v2.2.0\nrf\subsys\mpsl\init\mpsl_init.c:130)
    mpsl_timer0_isr_wrapper() (c:\nordicsemi\v2.2.0\nrf\subsys\mpsl\init\mpsl_init.c:128)
    <signal handler called> (Unknown Source:0)
    arch_cpu_idle() (c:\nordicsemi\v2.2.0\zephyr\arch\arm\core\aarch32\cpu_idle.S:108)
    k_cpu_idle() (c:\nordicsemi\v2.2.0\zephyr\include\zephyr\kernel.h:5627)
    idle(void * unused1, void * unused2, void * unused3) (c:\nordicsemi\v2.2.0\zephyr\kernel\idle.c:83)
    z_thread_entry(k_thread_entry_t entry, void * p1, void * p2, void * p3) (c:\nordicsemi\v2.2.0\zephyr\lib\os\thread_entry.c:36)

    =============================================================

  • We know that this ASSERT is intentionally triggered by MPSL when it finds out that its RTC0 interrupt context has been masked longer than it can allow. We have seen this assert before in different occasions and we have seen this or similar asserts when breakpoints were triggered in the application code.

    I do not understand how saw that you had breakpoints working before. The only explanation I can think of is that in previous builds you were using CONFIG_BT_LL_SW_SPLIT=y which means that you were using Zephyr controller which does not have the same limitation as our Softdevice_controller on not allowing the application to mask the softdevice specific interrupts. 

    Can you give me your project where you have breakpoints working with CONFIG_BT_LL_SW_SPLIT=n (and CONFIG_BT_LL_SOFTDEVICE=y) in older setup and have the breakpoints working. I have tried different samples from older SDKs and could not make the breakpoint work and then continue the application from there. 

    There might be another issue in the VSCODE debugging extension that might have a behavioral difference from old version to new version, in anycase, I do not see how VSCODE extension can overcome the limitation of "not masking softdevice interrupts" and still make the debug experience as if it was allowed.

Related