Diagnosing Bus Fault

I'm relatively new to hardware development and debugging.

I'm getting a bus fault at random points during hardware execution. 

I'm trying to use `arm-none-eabi-addr2line` to figure out where the offending instruction is, but I'm getting strange results.

Often, the Faulting instruction address reported by the device has no symbol on it - I get "??:?" when I try to look it up.

Sometimes, the reported offending line is a close-bracket (a "}").

Any help on this?

I'm currently using

VSCode with NRFConnect 2.3
Zephyr 3.3
Windows 10
I'm connecting the my board with a DK acting as the JLink.

Best,

S.

Parents
  • Hi again, sorry to let you wait!

    I'm relatively new to hardware development and debugging.

    No problem, it's great that you're looking into these kind of debugging tools. I should be using addr2line more myself.

    Anyway, the addr2line man page states the following:

    "If the file name or function name can not be determined, addr2line will print two question marks in their place. If the line number can not be determined, addr2line will print 0"

    So why can't addr2line find the file or function name? Compiler optimization is by far the most likely reason for this. GCC and other optimizing compilers will try (when asked) to make code faster without affecting functionality. But this has the side effect of the executable not directly matching your source code any more.

    This Stack Overflow page provides a good explanation: https://stackoverflow.com/questions/20816302/is-it-possible-to-use-addr2line-with-application-compiled-with-release-optimizat

    When you build a Zephyr application without any debug options, the default config is for GCC to optimize your code for speed (with -O3, I think). If you want to optimize for debuggability, you

    can add this Kconfig option:

    CONFIG_DEBUG_OPTIMIZATIONS=y

    (There's also CONFIG_NO_OPTIMIZATIONS which some are tempted to use, but I just learned from this little comment that CONFIG_DEBUG_OPTIMIZATIONS might actually produce faster code since it tries some -O1 optimizations.)

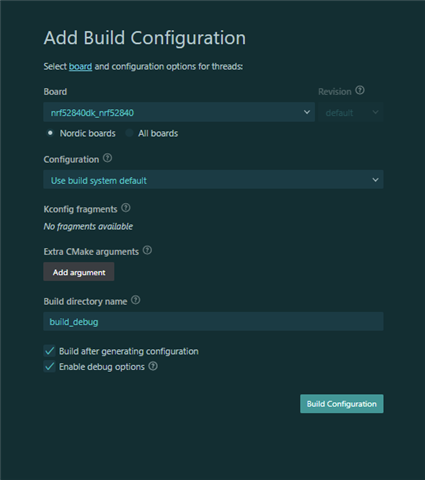
    Assuming you're using the VS Code extension, CONFIG_DEBUG_OPTIMIZATIONS is enabled automatically when you select the "Enable debug options" option when adding a new build configuration. So I recommend just adding a build configuration for debugging:

    Optimizing for debugging can make your code larger, so if you're unlucky, it might not fit in RAM/Flash anymore. But if it fits, I think addr2line should now work correctly.

    If it doesn't fit, you could perhaps optimize only part of your application, as described here:  Disable optimization of part of the code through CMAKE But I haven't tried that myself yet.

    Let me know if that works!

    Best regards,

    Raoul

  • Hi Raoul,

    Apologies for the late reply - We moved on to other issues and have only now had time for this.

    Sadly, none of the things you suggest are helping.

    Reading the Faulting Instruction Address gives the same "??:?" error.

    The only time I get a line number I can decode is when examining the `r14/lr` register. This consistently points to the same line in `libc-hooks.c`: 

    ```c

    /* Acquiure recursive lock */
    void __retarget_lock_acquire_recursive(_LOCK_T lock)
    {
        __ASSERT_NO_MSG(lock != NULL);
        k_mutex_lock((struct k_mutex *)lock, K_FOREVER);
    }
    ```

    This happens when I try to using `malloc()` to allocate space to a string pointer. It doesn't matter if the amount is dynamic or hard coded - this will still fault.
  • Hi, no problem!

    Sorry if I am repeating myself here, but could you just confirm whether you tried creating a new build configuration, with debug symbols turned on?

    Have you been able to use addr2line successfully before? If not, could you provide me with an example HardFault dump that you're getting, and an example of how you call addr2line?

    Something to note: if you are including some precompiled binary somewhere in your code it's possible that the HardFault is occurring there, with no debug symbols available.

    Beyond that, I just thought of something. Do you know approximately which change introduced your hard fault? If there is a change that you're short on stack space or memory, could you try cutting down on the stack space you're using? If the hard fault is occurring right after some kind of stack related issue, it could be that the instructions there are overwritten by some garbage that doesn't represent the original faulting instruction address. My knowledge on this is not very solid, but I think it's possible.

    See these two resources on memory footprint reduction:

    https://developer.nordicsemi.com/nRF_Connect_SDK/doc/latest/zephyr/develop/optimizations/footprint.html

    https://developer.nordicsemi.com/nRF_Connect_SDK/doc/latest/nrf/test_and_optimize/optimizing/memory.html

    Best regards,

    Raoul

Reply Children
No Data
Related